4 New UI Controls in Dynamics 365



Dynamics 365 now offers four new column visualizations that make it easier to interpret data directly within your views. Instead of displaying only plain text, these controls let you represent data as heat maps, line charts, radial dials, and star ratings.
Once applied, the graphic will display on any view in Dynamics 365. It’s important to note that these column visualizations on grids are still in preview.
4 Visualizations
There are 4 visualizations available today to apply on your columns:
Name | Graphic | Columns to Use |
Heat Map |  | Single number with defined range (0-100 for example) |
Line Chart |  | Text column with several numbers separated by commas |
Radial Dial |  | Single number 0-100 |
Star Rating |  | Whole number 0-5 |
Each visualization serves a different purpose, from highlighting numeric values to showing trends, progress, and ratings. Choosing the right control depends on your column’s data type and what you want users to understand immediately.
Heat Map
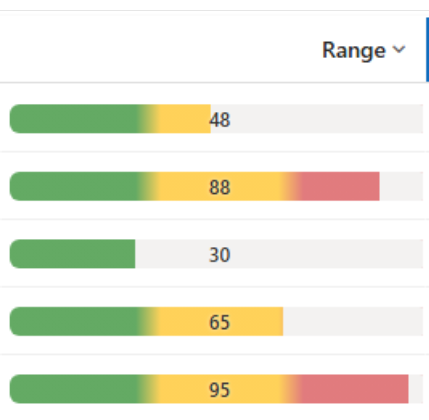
This visualization is best when you need to show a numeric value within a defined range, especially if users need to see if the value is low, medium or high. It can be a good fit if you are looking to represent a level, score, risk, or condition. Good examples of columns to apply this visualization to are:
- Customer Satisfaction Score (0-100)
- Account Health Score (0-100)
- Lead Qualification Score (0-100)
- SLA Compliance Score (0-100)
There are some known issues with this control. These include:
- It only works with single number columns. Non-numeric fields will display blank.
- Values outside the range will be pulled to the nearest end (0 or 100 by default).
It’s also worth noting that the colors are the opposite of what I personally would expect: Red means a higher score; green means a lower score. Keep the color scale in mind when selecting columns, especially when higher values represent positive results.
Line Chart
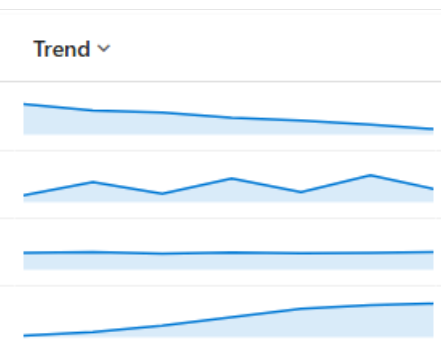
This visualization is excellent when you need to display a series of numbers so users can quickly recognize trends. Some examples of good columns to use with line chart are:
- Monthly Sales Trend
- Customer Satisfaction History
- Weekly Case Volume
- Website Engagement Trend
Here are some known issues with this visualization:
- The line chart uses a text column containing numbers separated by commas. It does not automatically retrieve historical values from other records.
- The chart needs more than one number to draw a line. Single numbers will appear as a dot.
- When the default range of 0-100 is used, anything outside that range will be flattened to the top or bottom edge.
- Anything that is not a number or comma will be blank.
Radial Dial
This visualization is best for showing progress towards a goal or completion percentage. Some great columns to use this with are:
- Sales Quota Attainment
- Percentage of Completion
- Onboarding Completion
- Training Completion Percentage
Some known issues about this visualization include:
- Values above 100 will show completely full; below 0 appear empty.
- Text values may show 0%.
- A value written as a ratio like 0.5 will be treated as 0.5% so the ring may appear empty.
Star Rating
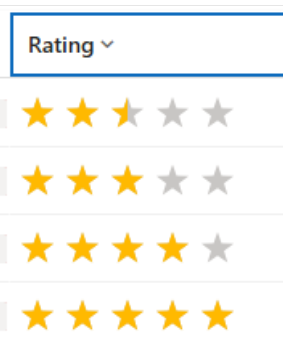
The star rating visualization is best for showing ratings or scores on a simple five-point scale. Some good columns to use it on include:
- Customer Satisfaction Rating
- Account Relationship Rating
- Vendor Performance Rating
- Service Experience Rating
Known issues with this visualization include:
- The maximum value is 5.
- Decimal values produce a partially filled star.
- Text values will render as no stars filled.
Adding Visualization to a New Column
When creating a new column, expand Advanced Options:
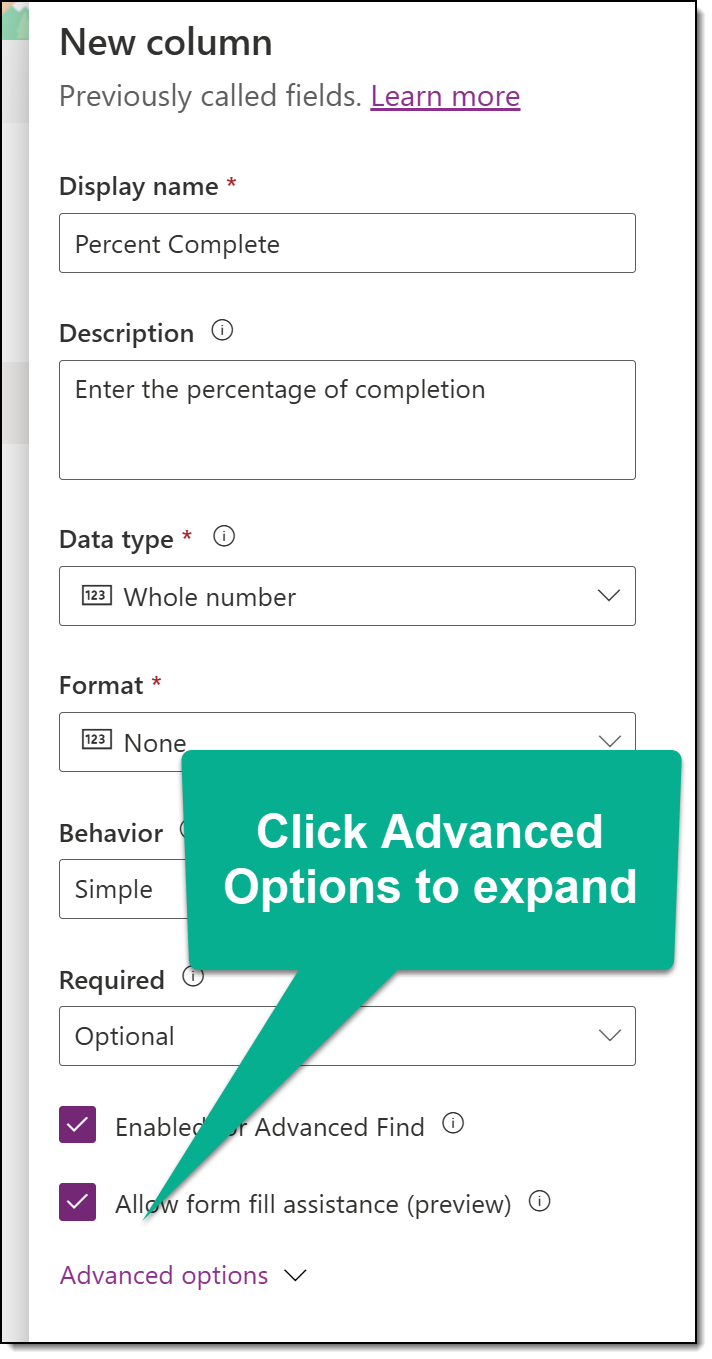
Once there, click in the Visualization field and select your choice (Radial Dial in this example):
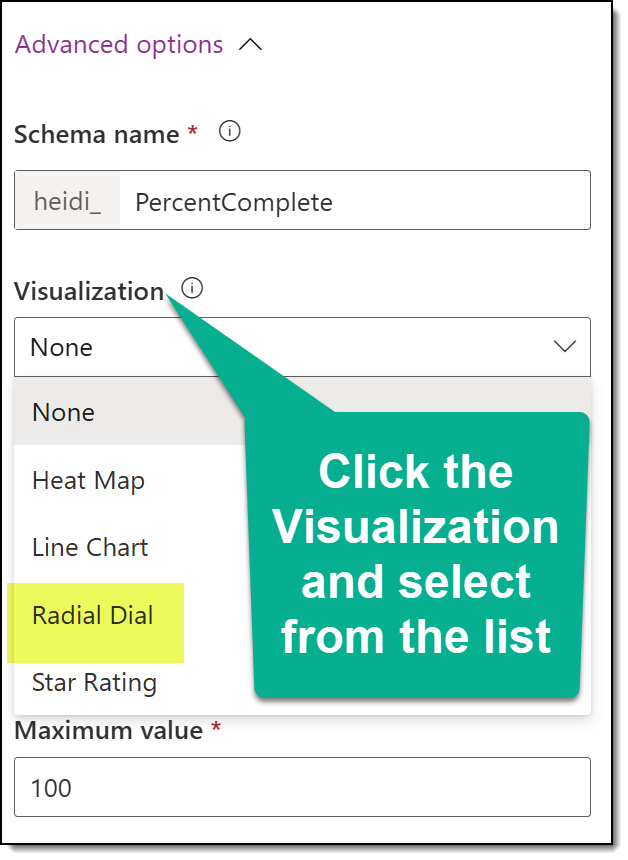
Then, click Save.
Adding Visualization to an Existing Column
In a solution file, add the table and column. Open the existing column and expand Advanced Options:
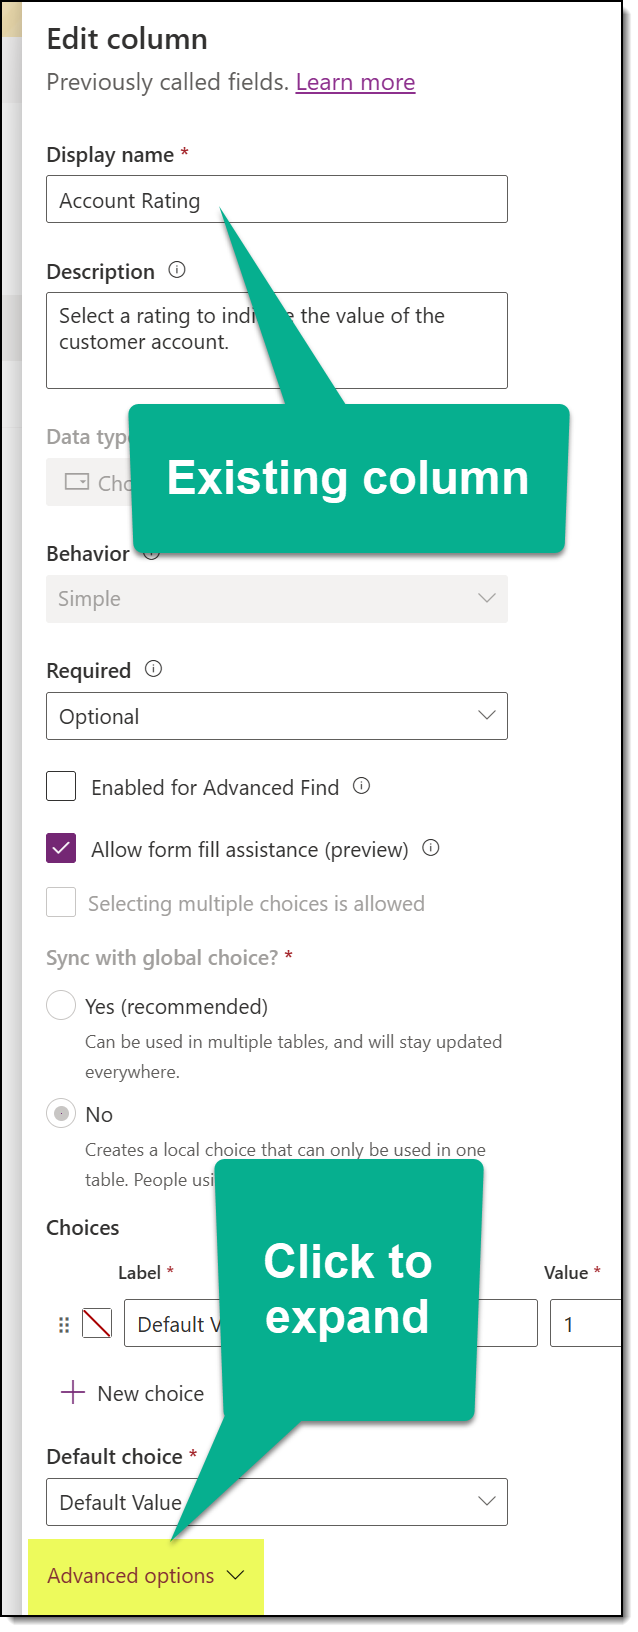
Find the Visualization area and select your control:
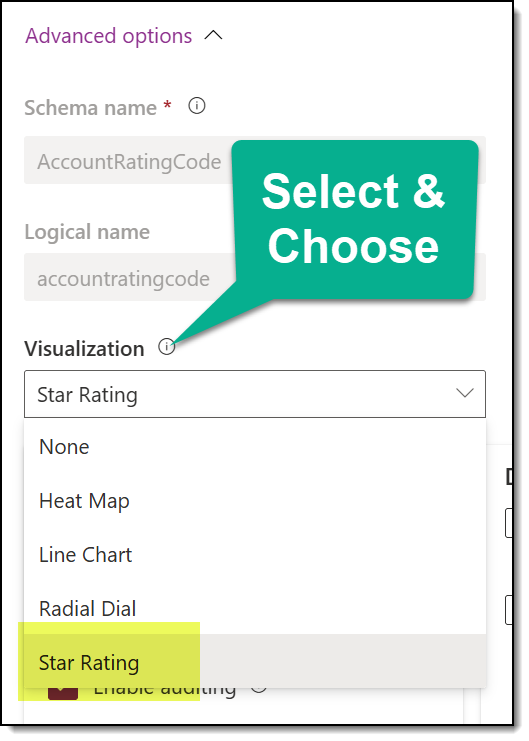
Then, just save!
How It Looks in Dynamics 365
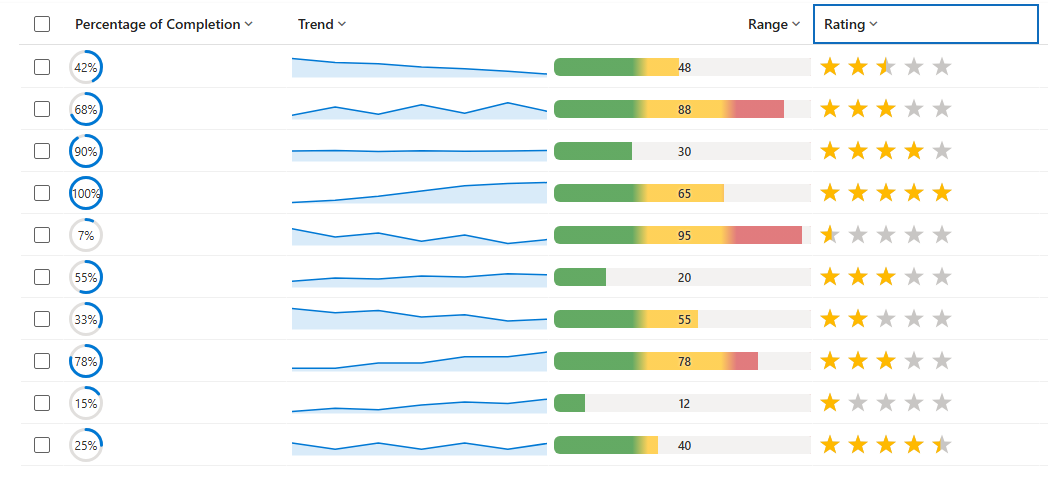
Here is a before, with columns for percentage of completion, trend, range and rating:
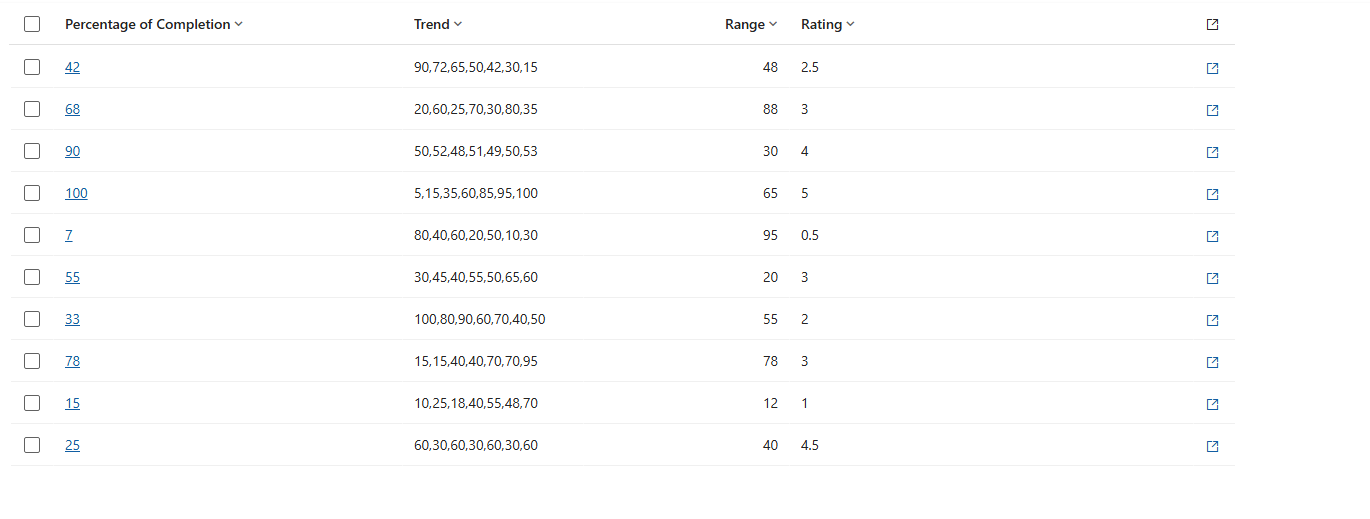
All columns display plain text data in the view. Here is that same data with visualizations applied:
Final Thoughts
Column visualizations make data easier to interpret and help users identify trends, progress, and ratings directly within a Dynamics 365 view. As you get started applying these, you may run into issues and unexpected results. There is a full list of common outcomes and data-format issues in this Microsoft Learn article that may help you troubleshoot.