Understanding How to Navigate Power BI Reports in Microsoft Dynamics 365 Supply Chain Management
In the modern and competitive business world, firms are more and more turning to data-driven insights for making enlightened decisions. Microsoft Dynamics 365 Supply Chain Management’s Power BI Reports furnish real-time analytics and details about supplier performance and potential pitfalls, proving themselves indispensable for entities keen on enhancing their supply chain functions. Manufacturing businesses can employ Power BI Reports to oversee inventory, keep an eye on supplier output, and spot likely bottlenecks in the supply chain. Retailers have the ability to delve into sales figures, optimize inventory levels, and pinpoint cost-saving chances through these reports. By observing performance metrics, delivery specifics, and other crucial data points, Power BI Reports emerge as adaptable solutions tailored to satisfy the distinct demands of any establishment aiming to refine its supply chain strategies and achieve an advantage over rivals.
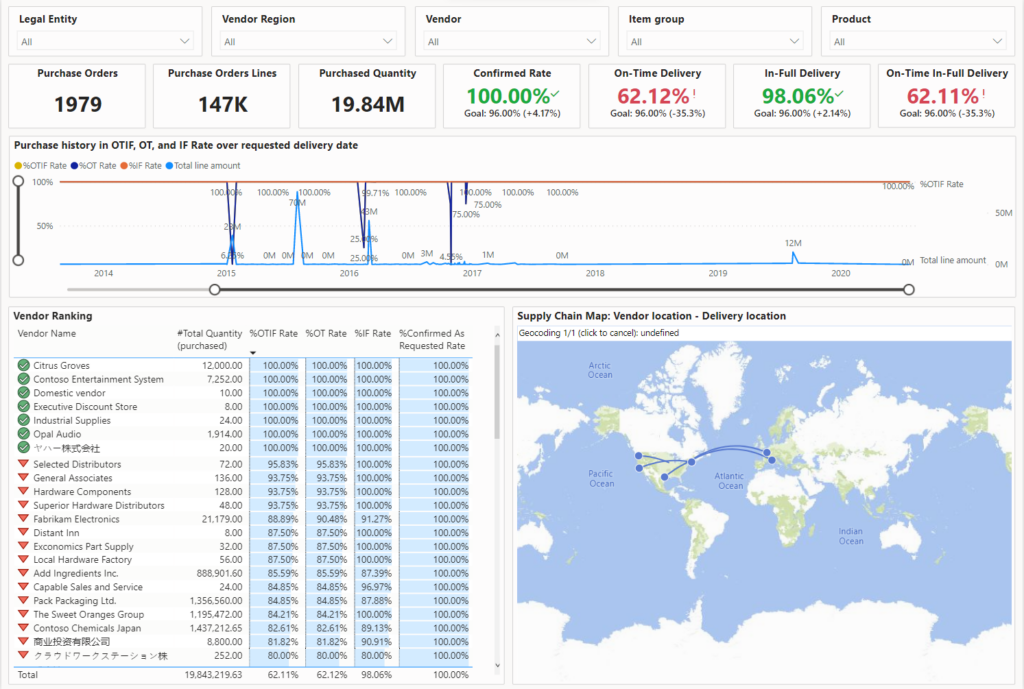
This capability introduces a merged risk and output report plus two integrated reports dedicated to supplier performance scrutiny and hazard evaluation. Each of the trio of reports harnesses Power BI, boasting extensive filter and data segmenting features that guide users in spotting urgent supplier performance challenges and prospective supply hazards. On these reports, tiles representing metrics and primary performance indicators (KPIs) encapsulate the performance under each chosen filter dimension, counting purchase orders and their individual lines. Some even illustrate projected order quantities and on-time delivery performance rates. As users adapt filters or pick varied vendors, items, areas, or delivery approaches, these tiles refresh instantly, facilitating the recognition of links with varying elements influencing supply efficacy.
Read this blog to delve deeper into the Power BI capabilities in Microsoft Dynamics 365 Supply Chain Management.

Integrated risk and performance report
This integrated report presents data solely about envisaged orders, making it particularly pertinent for gauging risks. It amalgamates facets of the pair of integrated reports. For directions on employing and understanding this report’s multiple perspectives, kindly refer to subsequent sections.
Accessing this report can be achieved in a couple of manners:
- Navigate to Procurement and sourcing > Queries and reports > Supply risk evaluation > Supply risk evaluation.
- Or, head to Procurement and sourcing > Workspaces > Supply risk assessment, then under the Links FastTab, tap on the Supply risk assessment option.
Embedded supplier performance study
This integrated report in the workspace offers a comprehensive performance evaluation, encompassing not just predicted orders but all formerly acquired goods as well.
To launch this integrated performance analysis, travel to Procurement and sourcing > Workspaces > Supply risk appraisal, subsequently choosing the Performance segment.
Every performance evaluation report has a heading containing data segmenting tools and filters. To narrow down, opt for products and employ these tools and filters to select pertinent business entities, zones, suppliers, and product groups. Filters are retained across diverse report pages, eliminating the need for constant reapplications.
Vendor and product ranking examination
Employ the pair of parallel reports on product and vendor rankings to understand historical order outcomes in terms of OTIF deliveries. Locate OTIF patterns and exceptions in the delivery chronology, observing them against total line figures.
Zoom capability allows a closer look at the timeline and the selection of individual data units to view corresponding vendors or goods. Alternatively, pick a vendor or multiple vendors based on their rank to view the related performance chronology.

Multi-dimensional OTIF ranking
Here, the poorest OTIF ranks are derived from different viewpoints and shown collectively for items, suppliers, delivery techniques, and locations. Use singular or combined dimensions to find hindrances potentially leading to supply performance decline.

Integrated supply risk evaluation
The workspace-integrated supply risk study presents a thorough performance evaluation, not just for anticipated orders but all products procured in the past.
To launch the integrated performance study, head to Procurement and sourcing > Workspaces > Supply risk assessment, and choose the Risk section.
The risk evaluation translates performance observations into a risk metric for projected orders, considering purchase order receipts.
All risk evaluation reports include a heading with a data segmenting tool and filters, inclusive of a main plan choice tool. Use this to pick a singular primary plan, averting potential double counting of expected orders from various schemes.
Risk assessment snapshot
This report aids in analyzing projected procurement risks. Post-filter application, the top 10 items ranked by risk are displayed by their collective quantity and value. The high-risk label is a result of multiplying the projected product quantity and value by the observed OTIF rate from past orders. The residual total quantity or value represents low OTIF risk.
Note
For the risk evaluation, the most statistical significance is seen when the majority of order lines during the observed period are for goods where minimal changes are foreseen in nearby conditions.
By focusing on a set of predicted product provisions, you can explore further performance metrics related to the items and suppliers linked to these orders.

Detailed procurement risk details
The detailed list of predicted procurement risks displays every at-risk product within their categories, alongside their predicted quantity and value, as well as the associated risk values.
This perspective aids in reviewing suppliers from prior orders that resulted in unsatisfactory outcomes. Reflect on utilizing alternate or additional suppliers to curtail risks in upcoming orders.

Comparison of vendor locations for past and future orders
For a superior contrast of the main supply source (vendor locale), you can examine the juxtaposed geographical maps. These visual aids emphasize the origins of supplies for purchase orders against projected supplies.

Supply flow comparison between historical and anticipated supply
A deeper dive is possible into the supply journey from origin to destination, comparing historical acquisitions and forthcoming supply. Filtering by items recognized as at risk and by delivery methods helps pinpoint potential threats introduced by the delivery route and technique.
Next Steps
If you are interested in learning more about the PowerBI Reports Microsoft Dynamics 365 for Supply Chain Management, contact us here to find out how we can help you grow your business. You can also email us at info@loganconsulting.com or call (312) 345-8817.
