How Business Central’s Analysis Mode Turns Every List into an Instant Data Review Tool


If you ask Business Central users how they analyze their data, most will say the same thing: “Export to Excel.” And yet, hidden in plain sight on almost every list page is one of Business Central’s most powerful, least-used features, analysis mode.
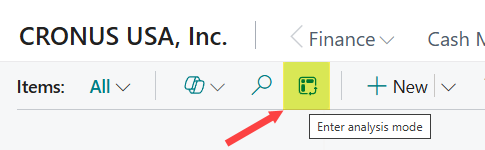
Analysis Mode
In this post, I’ll show you how analysis mode can transform your daily, weekly, and project‑based data reviews and reconciliations by exposing data quality issues, revealing patterns, and eliminating unnecessary exports. Whether you’re preparing for UAT, validating a data migration, or auditing an existing environment, analysis mode can quickly become your go‑to tool for sanity‑checking your setup and transactions as well.
Why Analysis Mode Matters
Analysis mode instantly turns any list page into a flexible pivot‑style analytics workspace – without leaving Business Central.
Here’s why it’s so valuable:
- See data completeness at a glance (e.g., missing costs, prices, posting groups)
- Spot outliers immediately (blank fields, unexpected values, odd groupings)
- Quick record counts (How many vendors? How many items using Lot Tracking?)
- Group and subtotal data in seconds
- Stay in context with drill‑through back into the record
And once you start using it, you begin to realize: Nearly every BC list has hidden insights just beneath the surface.
1. Before You Begin: Set Up Your List Page
Analysis mode only analyzes fields that are already visible on the list page. So before turning it on:
✔ Personalize the list page to include the fields you’ll need
Examples:
- Items → Cost, Price, Item Tracking Code, Posting Groups, Unit of Measure
- Vendors → Payment Terms, Payment Method, Location Code, Address fields
- Customers → Taxable, Ship‑to details, Salesperson Code, Price Groups
A quick personalization pass, or better yet – a modification to the Role Center/Profile, goes a long way toward unlocking better insights and making things easier.
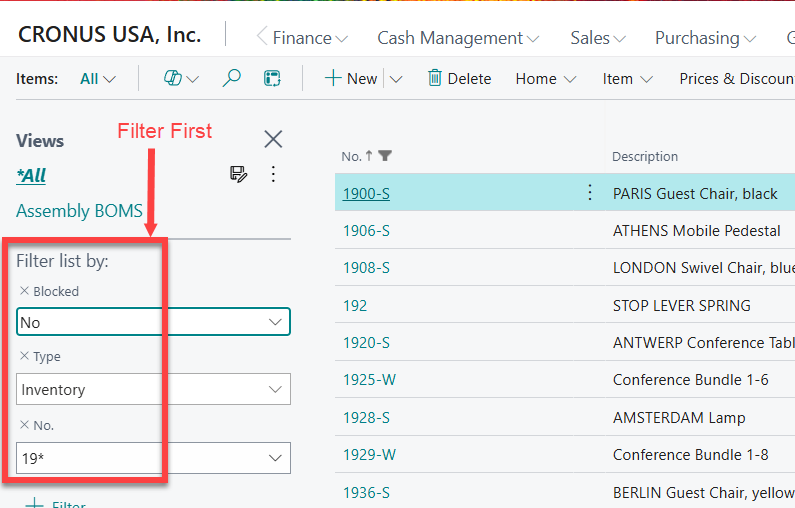
✔ Remember: Filters carry over
If you only want to review unblocked records or a specific item type, apply those filters before switching to analysis mode.
2. Inventory & Items: My Favorite Analysis Mode Checkpoints
The Item List is one of the richest places to use analysis mode. Here are my go‑to views:
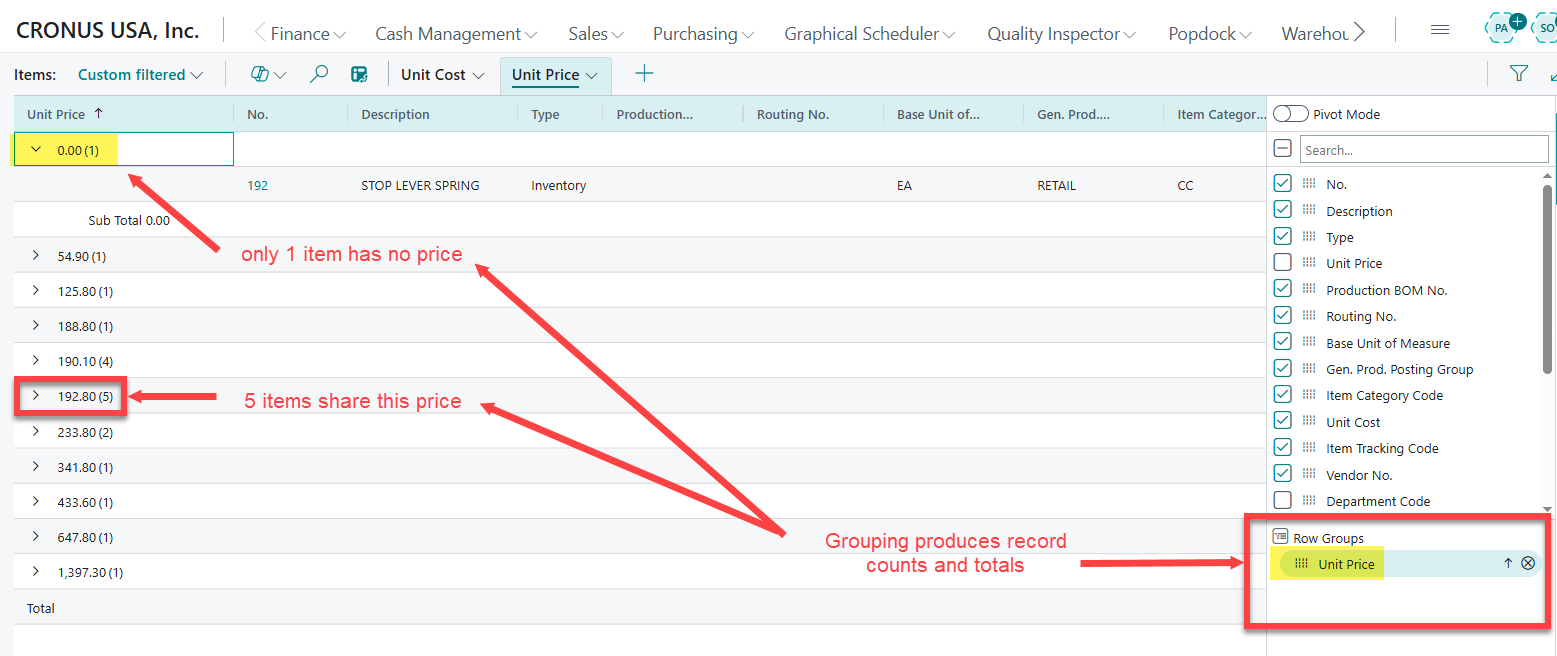
A. Cost & Price Completeness
A missing “Unit Cost” or “Unit Price” might seem minor, but it creates friction for users, downstream integrations, and transaction posting.
Group by:
- Unit Cost
- Unit Price
Blank values immediately stand out.
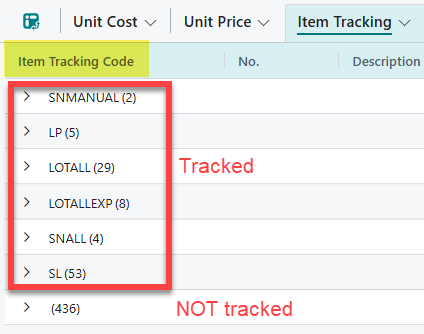
B. Item Tracking Code Analysis
Quickly answer questions like:
- How many items require Serial Tracking?
- How many use Lot Tracking?
Group by Item Tracking Code and subtotals tell the story instantly.
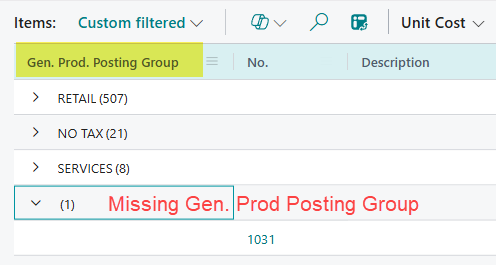
C. Posting Group Coverage
Product Posting Groups are essential for the GL. A group-by view shows:
- Which items lack assignments
- Whether any posting groups are underused or misapplied
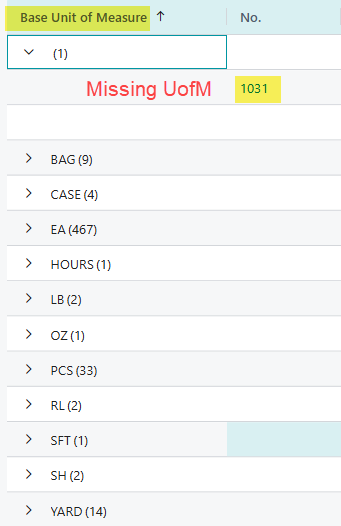
D. Units of Measure Validation
Group on Base, Sales, and Purchase UOM to see inconsistencies across the catalog.
3. Vendor List: Clean Vendor Data = Clean Purchasing
The Vendor List can effectively serve as a purchasing dashboard — and analysis mode makes it even more powerful.
Recommended checkpoints:
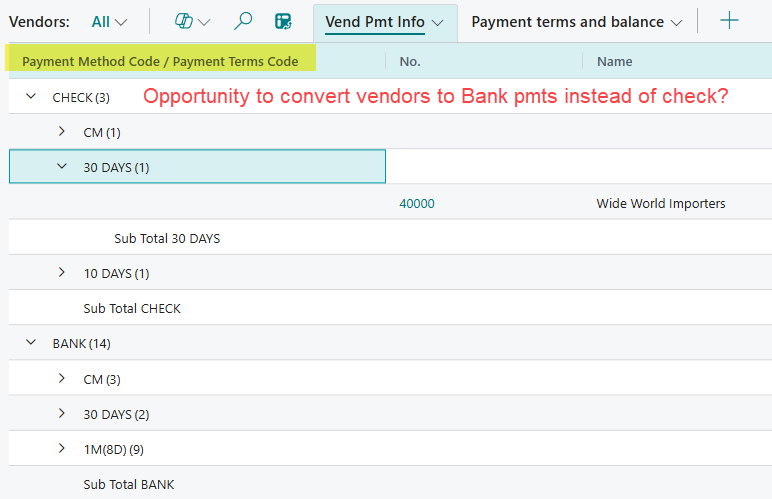
- Payment Terms → ensure automation of due dates
- Payment Method → ensure batch payments work smoothly
- Location Code → validates defaults for purchasing flows
- Primary Contact Name & Email → spot vendors with missing or outdated contacts
- Last Modified Date → understand age and activity of records
Grouping by some of these fields gives a fast overview of vendor data quality.
4. Customer List: The Command Center for Sales Teams
Customer data drives pricing, shipping, tax calculations, and communications. I often end up adding 20+ fields to the list page to support meaningful analysis.
Key fields to review:
- Location Code, Shipping Method, Shipping Agent
→ ensures automated population of orders and invoices - Price Groups
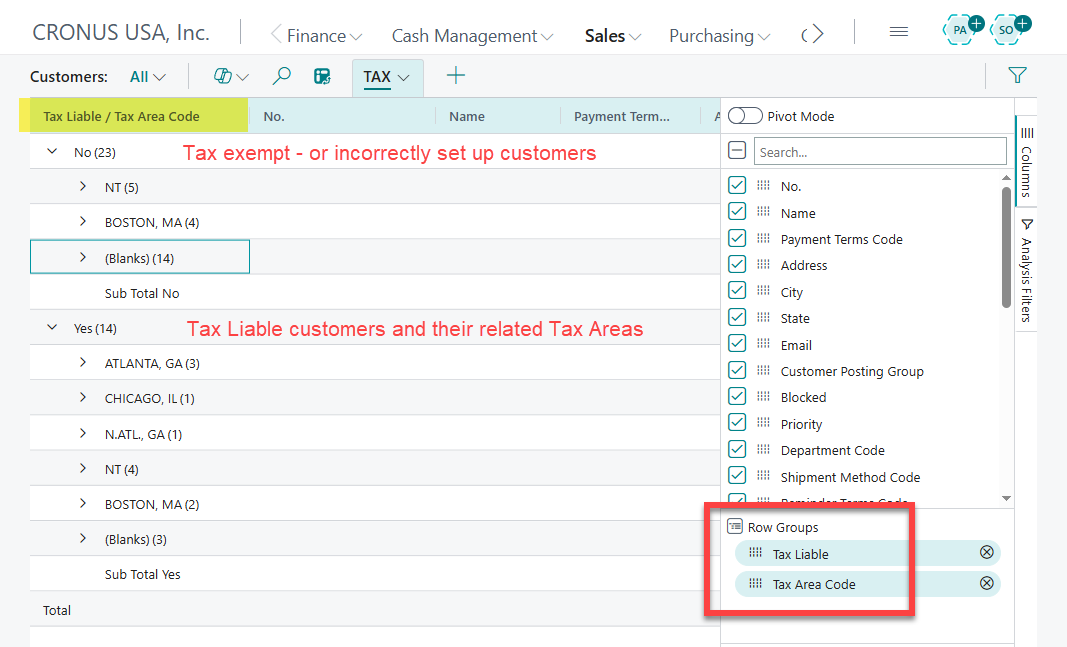
→ essential when using Sales Price Lists - Tax Area Code + Tax Liable
→ great grouping to review tax configuration health - Statement/Reminder/Finance Charge Flags
→ detect customers marked to receive documents with no email contact defined
Pro tip: Add Balance and Balance Due to the list — then switch to analysis mode for instant subtotals and quick drill‑downs.
5. Performance Tips
A few practical notes from field experience:
- Large datasets may take a moment to render in analysis mode (use filters first to help)
- Multiple tabs = multiple saved “views” (great for recurring review analysis tasks)
- Use filters wisely (and remember they are on!)
- Remember, the Filters pane can be hidden (and forgotten!)
Conclusion: Empower Users Without Leaving Business Central
Analysis mode is one of the best ways to help end users, analysts, and even functional consultants validate data, prepare for UAT, audit a live environment, or simply better understand their records – all without exporting to Excel or writing queries.
If your team isn’t using analysis mode yet, this is the perfect time to encourage them to turn it on and start exploring. Then take your skills to the next level by reading all about it here.
