An Introduction to Using the Open-Source Power BI Reports for Business Central


The day I’ve been waiting for has finally arrived. The Power BI apps for Business Central (BC) have become available as open source. What exactly does that mean, though? Let’s do a quick dive through just some of what’s possible so you get the idea!
New Release
By now, I’m sure you’ve heard about the 75+ new Power BI reports released for Business Central.
Microsoft has continued to improve them, with a new version starting with 26.2, which is easily searchable on AppSource. These new reports have some changes, but the key thing to note is that they are also being released as open source, meaning Microsoft has invested heavily in providing analytics models for various BC modules along with a bunch of fancy and useful reports and dashboards.
Now that these are open source, you can download and save a copy, then change and add new pages to the *.pbix report workbook or just build upon the model that has already been prepared for you. WOW! I personally found this amazing.
I hope BC users and IT Admins can see this as saving hundreds of hours of report building or consulting costs!
Examples
Let’s walk through a few simple real-life examples of changes I made to demonstrate how this works.
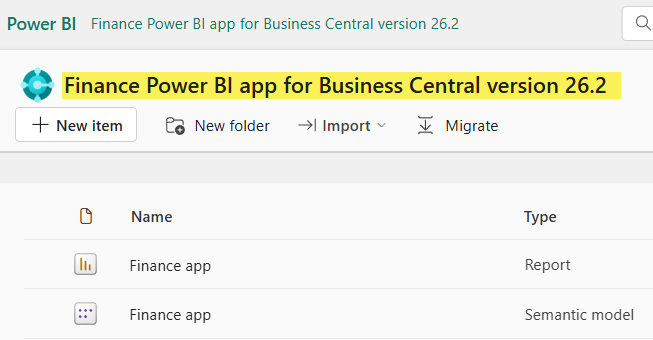
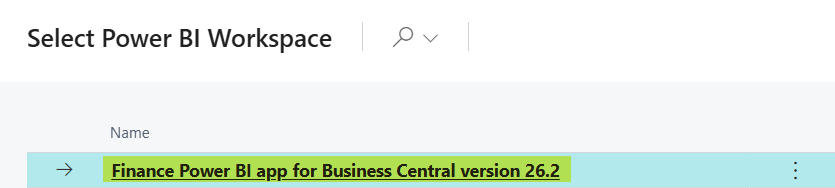
First, download a new copy of the Power BI Finance App to a new Power BI Workspace.
The one I created appears below and was done as part of the download routine into a new Workspace that I named “Finance Power BI app for Business Central version 26.2”. I was then able to easily compare this new report to the prior version I had in another workspace, as the older version did not get overwritten.
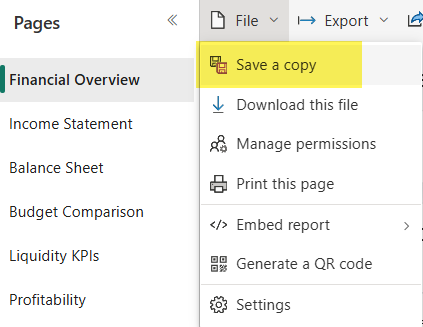
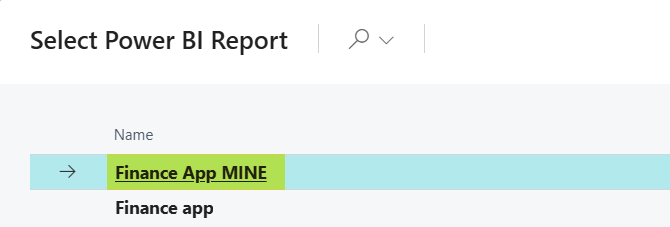
After downloading and installing the Power BI Finance App, I opened the app and connected it to my BC data then refreshed it. Next, I opened the report and clicked File 🡪 Save a Copy of the “Finance app.PBIX” file off to the side with my own name.
Eventually, Microsoft will have updates or changes to their report model, so I want to have my own copy to use on the side that doesn’t get overwritten with updates, which will be inevitable in the future. In this case, I called the new one “Finance App MINE.pbix.”
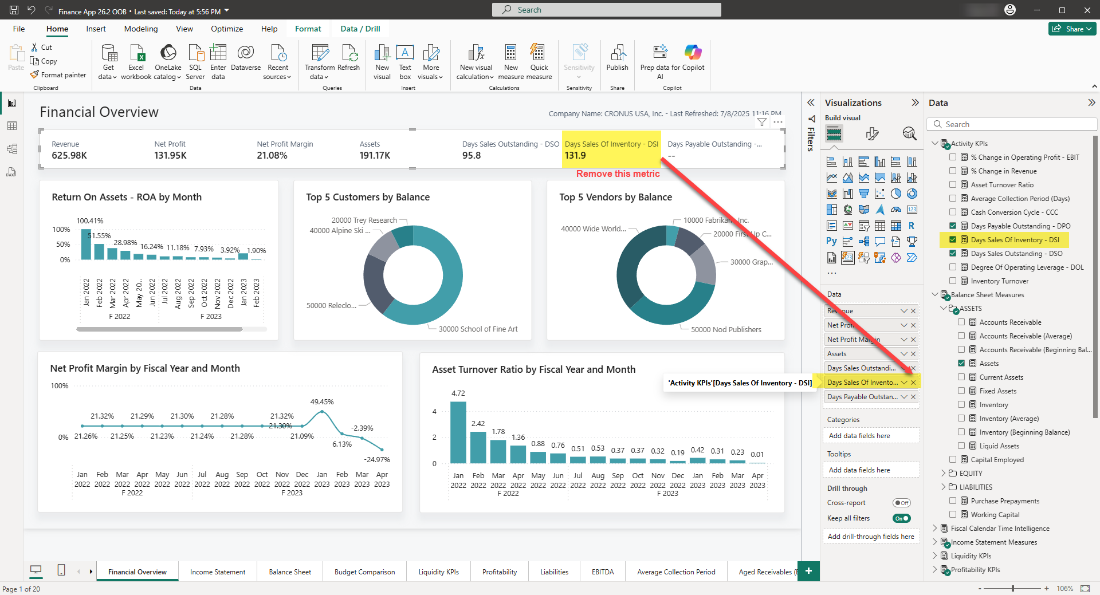
I opened my shiny new “Finance App MINE” Report and made some changes to a few sections, as illustrated below, to demonstrate the “art of the possible” now that we have open-source reports!
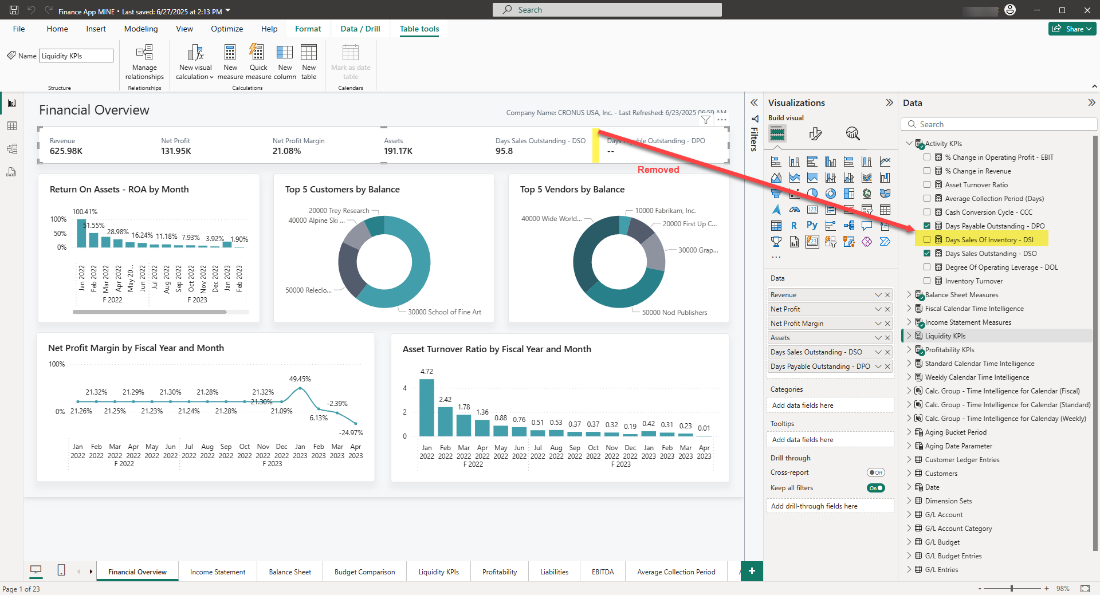
1) Removed the INVENTORY section from the Finance dashboard. Why? Some customers have asked for various elements of this card tile to be removed because they don’t apply to their business, and I am happy to report back how easy it is to do! Just activate the card and x-out the measure from the list. Want to reorganize the order? Just drag and drop up a measure or down to change the presentation.
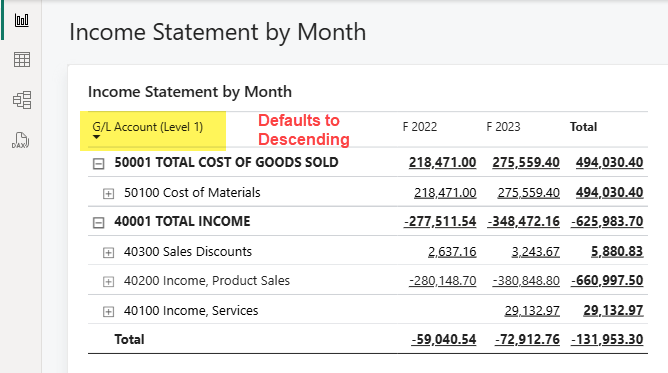
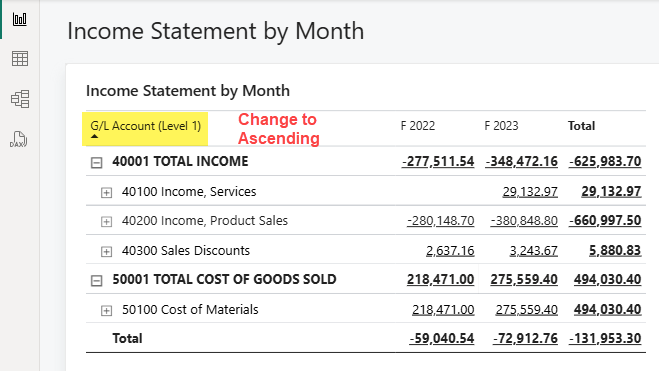
2) Changed the SORT ORDER on the Income Statement dashboard to be ascending instead of descending. It puzzled me why the original reports came sorted descending, but now we can easily fix this.
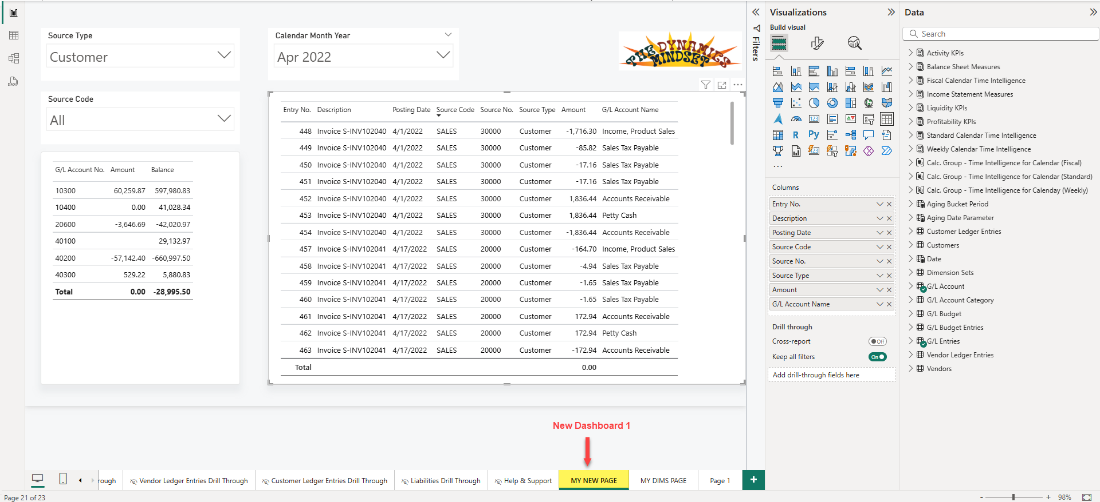
3) Added two of my own dashboards to the end of the report. After I reviewed the model in the report, I had a better sense of what data was being captured. As expected, the Finance model has limited fields from the GL, Customer and Vendor ledger entries.
There are no Sales Order/Invoice, Inventory, or Purchase Orders in the base Finance report, so I would look into the appropriate app reports to get more into the ledger detail for those modules and features.
In the report, I added a couple of new dashboards using the Ledger Entries from the model. The idea here is to use a slicer to get quick Year-Period data on the dashboard, with flexibility for multiple selections (e.g. 3 consecutive months), and to also be dynamic in nature (updating the grand total).
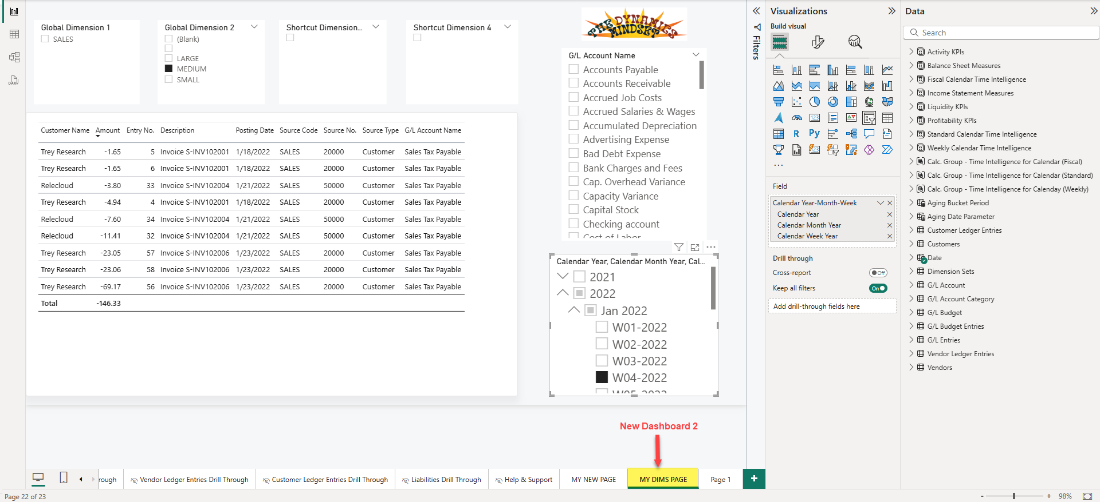
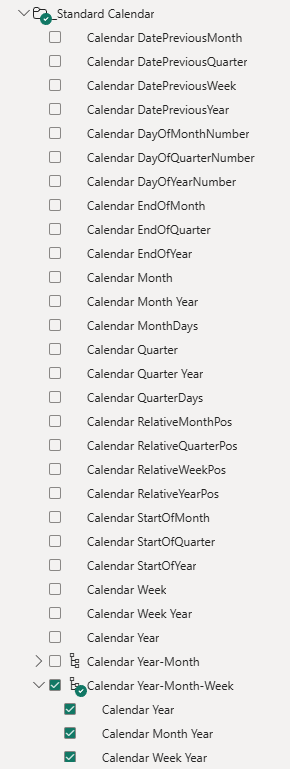
One of my favorite things about the Finance model is the Date/Calendar section. Report writer-types like me need to use time-based slicers frequently. This model came with plenty of time-intelligence based calendar objects to choose from. Some of the heavy lifting for report writing is already done without any coding whatsoever!
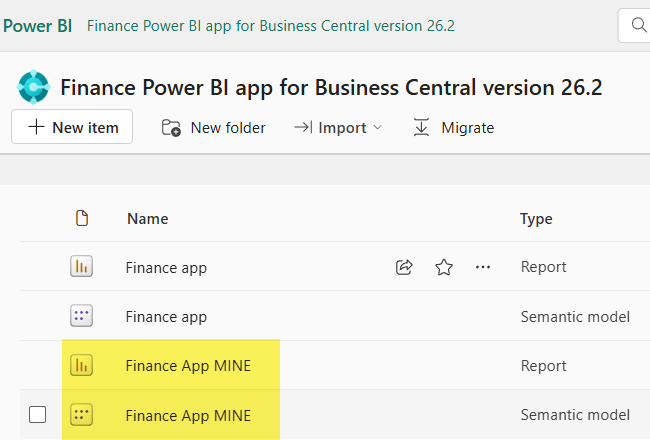
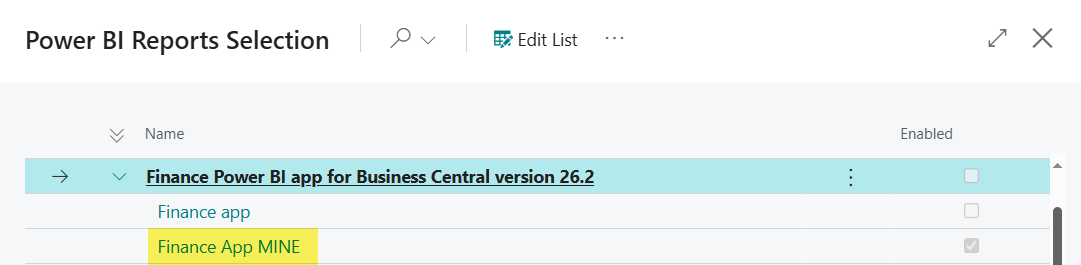
When I was done with all three changes, I published the new report to the same Power BI workspace. The new report and Power BI model appear, alongside the original. After republishing this modified report to the Power BI service, I have a cleaned-up, more useful version of the finance reports, versus what comes off-the-shelf, or out-of-the-box. Plain and simple as that!
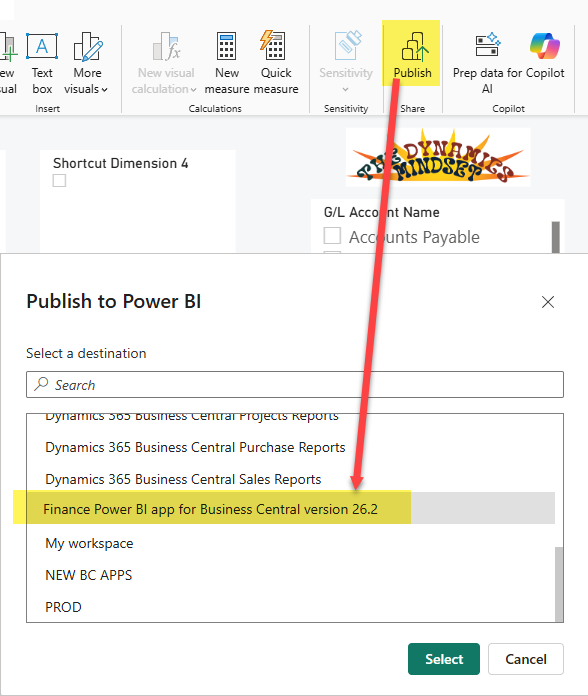
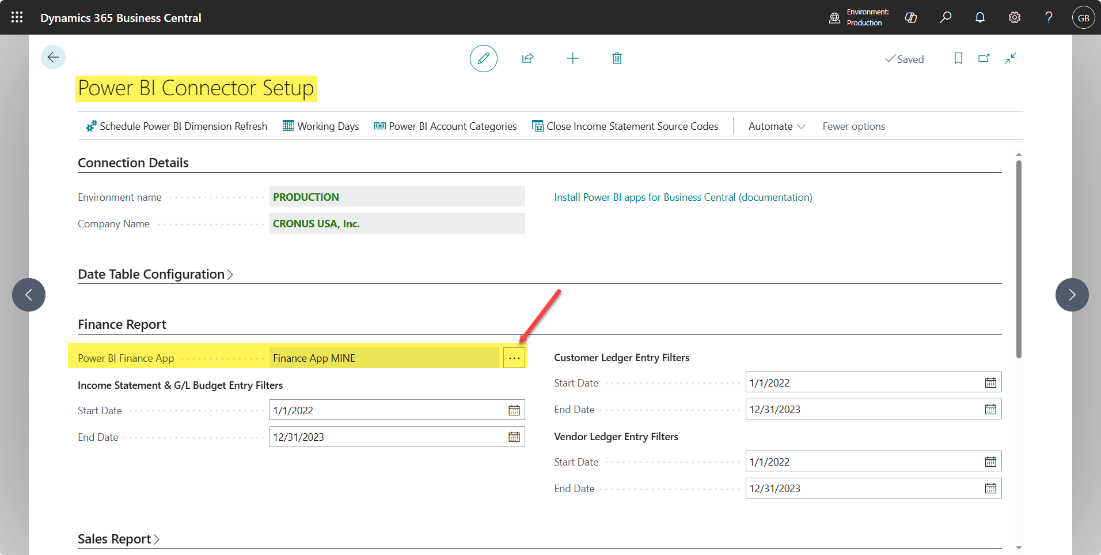
From within BC, I can point the Power BI Connector setup to my Power BI App report that I just published, and then everyone in the organization has the option of taking advantage of the new report as well.
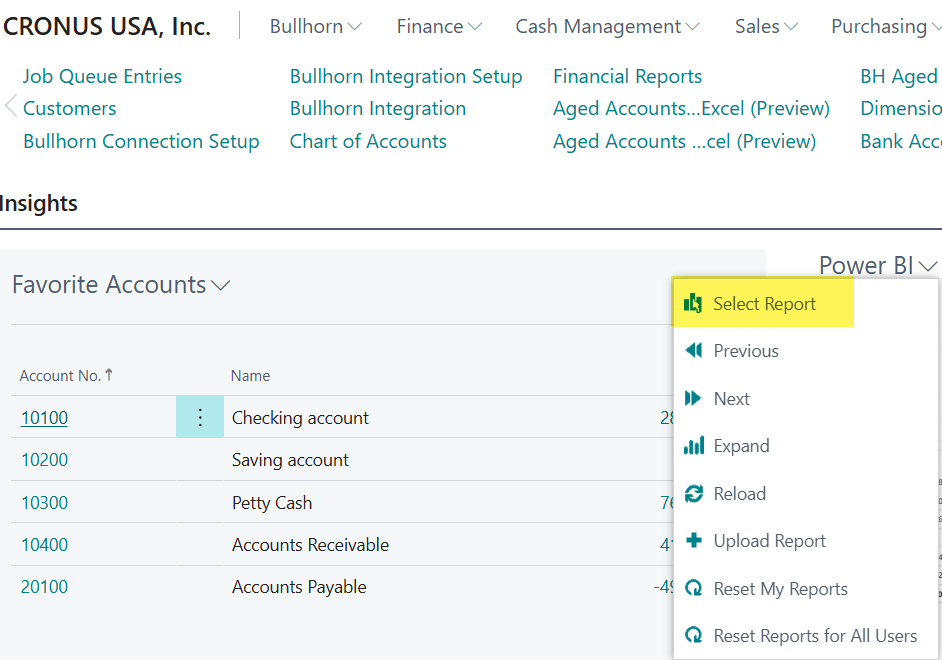
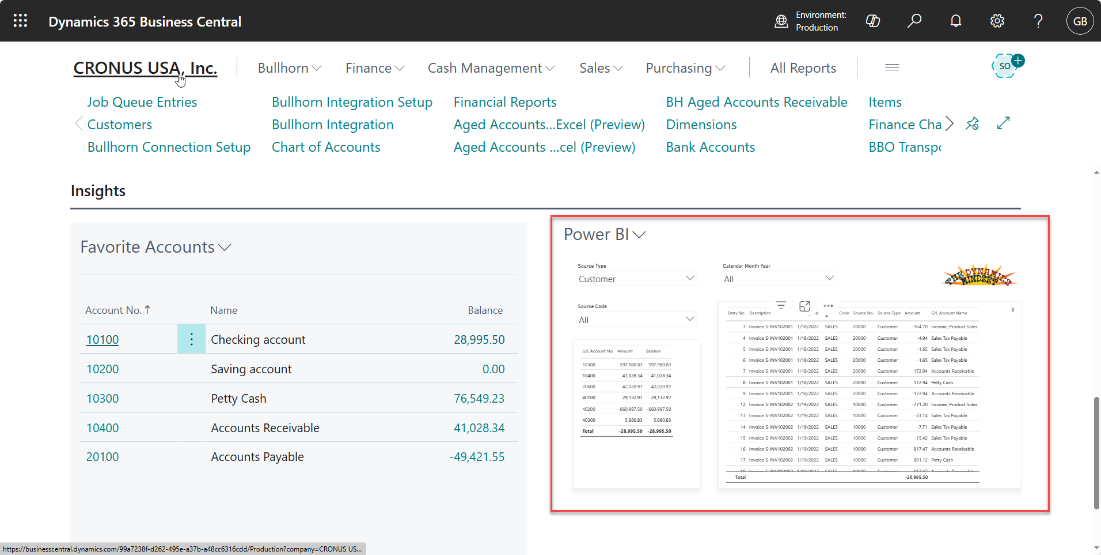
Finally, to bring it all back home and make this demonstration real, from the Role Center, users can select and embed the newly-added, modified, open-source report on the Role Center.
Now you can see how useful this might become for you.
The first custom report I created using the open-source Power BI report model was designed to be similar to, but proves to actually be more functional than, the Favorite Accounts tile I had placed on the Role Center for monitoring. With the open-source Power BI Finance App embedded next door, I have all of the accounts, with a date slicer available for quickly analyzing my numbers.
Final Thoughts
Power BI is just another fabulous way to prepare and present a truly meaningful view of your data in Business Central. I hope you find ways to dial these open-source reports in to help with your own reporting too!
