Power BI Reporting App Enhancements for Business Central v27


As the v27 Business Central releases continue to roll out to environments everywhere, I want to direct you to the updated Power BI Reporting Apps designed to go with v27 of the platform. In comparing their version 26.2 predecessors, we have some updates and new dashboards to explore once you get upgraded to the newest release of Business Central, v27.
These reporting tools have evolved a long way over the last few versions, and after studying some changes in the Finance, Purchasing, and Sales apps, I’m happy to share some insights for those who want to gain an edge on the latest reporting capabilities with Business Central.
Getting the Right Reports for your Business Central
It is getting crowded out there with three available versions of the Power BI Apps in AppSource. Be careful which one you choose to pull over into your Power BI Service. This post is about the latest version of the app reports that come with BC version 27, also known as 2025 Release Wave 2. The screenshot below also applies to the Sales and Purchasing apps when searching for them on AppSource.
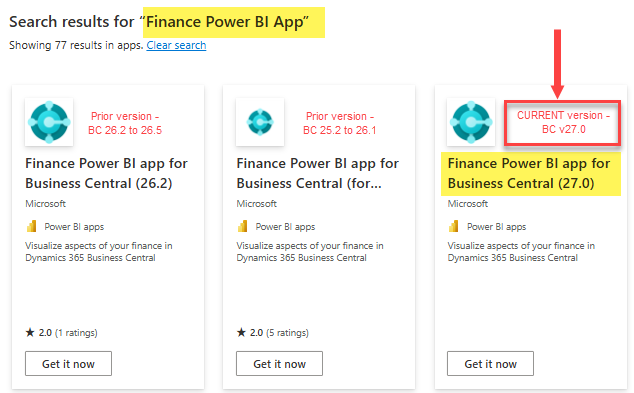
But why bother searching? Just use the links right here to access the full list of v27 apps directly!
|
To get the template app for… |
In Business Central versions |
Use this install link |
|---|---|---|
|
Finance |
27.0 and later | https://aka.ms/bc-pbi-finance-app |
|
Inventory |
27.0 and later | https://aka.ms/bc-pbi-inventory-app |
|
Inventory Valuation |
27.0 and later | https://aka.ms/bc-pbi-inventory-valuation-app |
|
Manufacturing |
27.0 and later | https://aka.ms/bc-pbi-manufacturing-app |
|
Purchasing |
27.0 and later | https://aka.ms/bc-pbi-purchase-app |
|
Projects |
27.0 and later | https://aka.ms/bc-pbi-projects-app |
|
Sales |
27.0 and later | https://aka.ms/bc-pbi-sales-app |
|
Subscription Billing |
27.0 and later | https://aka.ms/bc-pbi-subscription-billing-app |
|
Sustainability |
27.0 and later | https://aka.ms/bc-pbi-sustainability-app |
If you already have the older v26 reports, rest assured you can save these new v27 reports in a new Power BI Workspace.

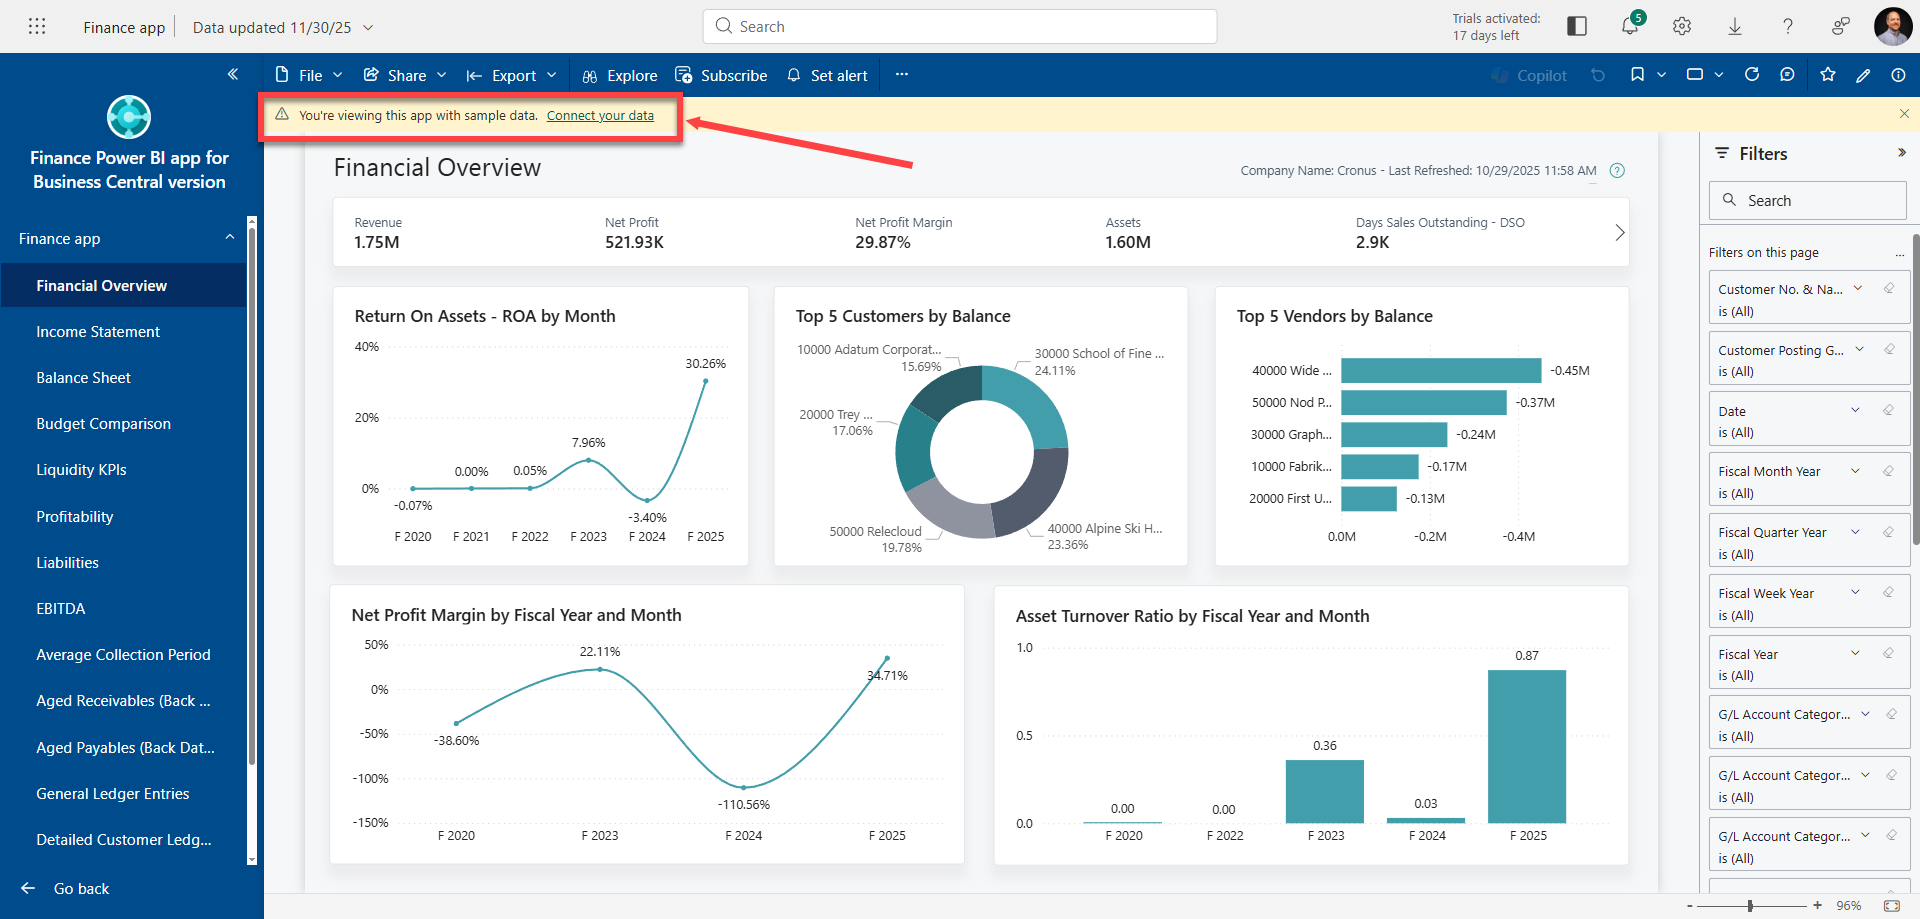
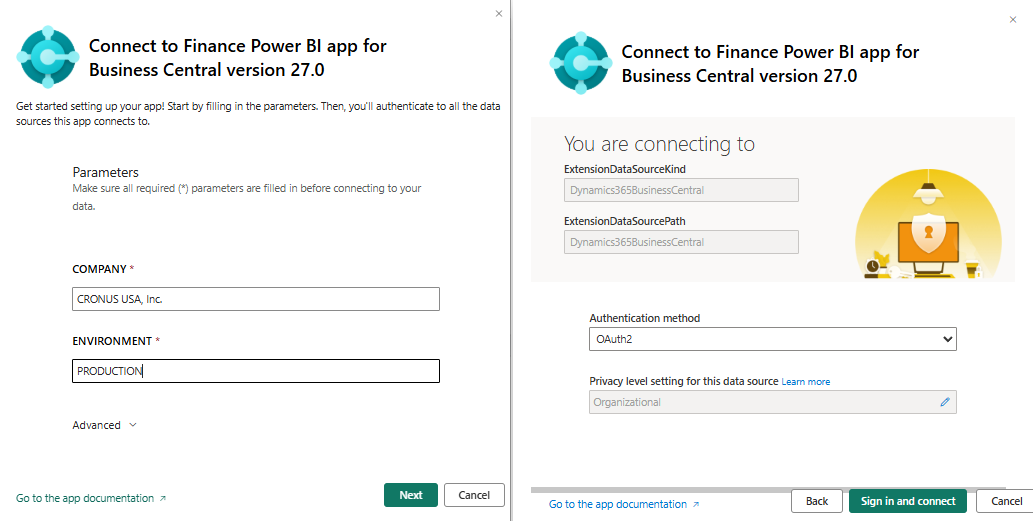
After you save the new apps, you will need to connect them to your Business Central environment using the prompt inside each one. The data should refresh in a matter of minutes. The app will automatically refresh once a day moving forward as well.
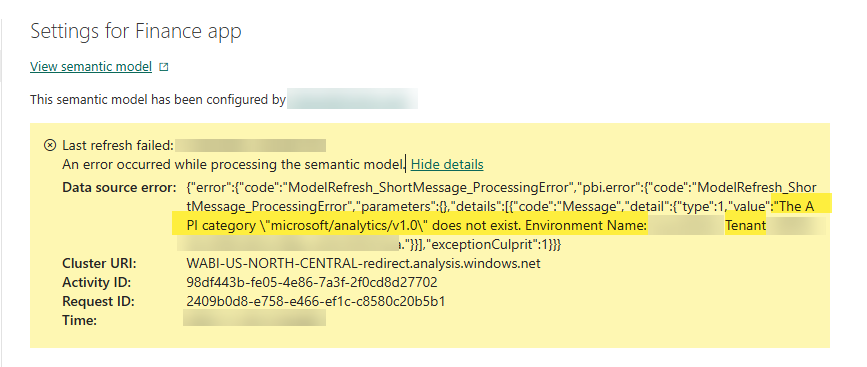
Should you attempt to try to use the newest 27.0 Power BI App reports with an incompatible (e.g., older) Business Central database, you will likely encounter an error of the following nature, indicating an invalid API version for the reports:
Drillback into Business Central from Power BI
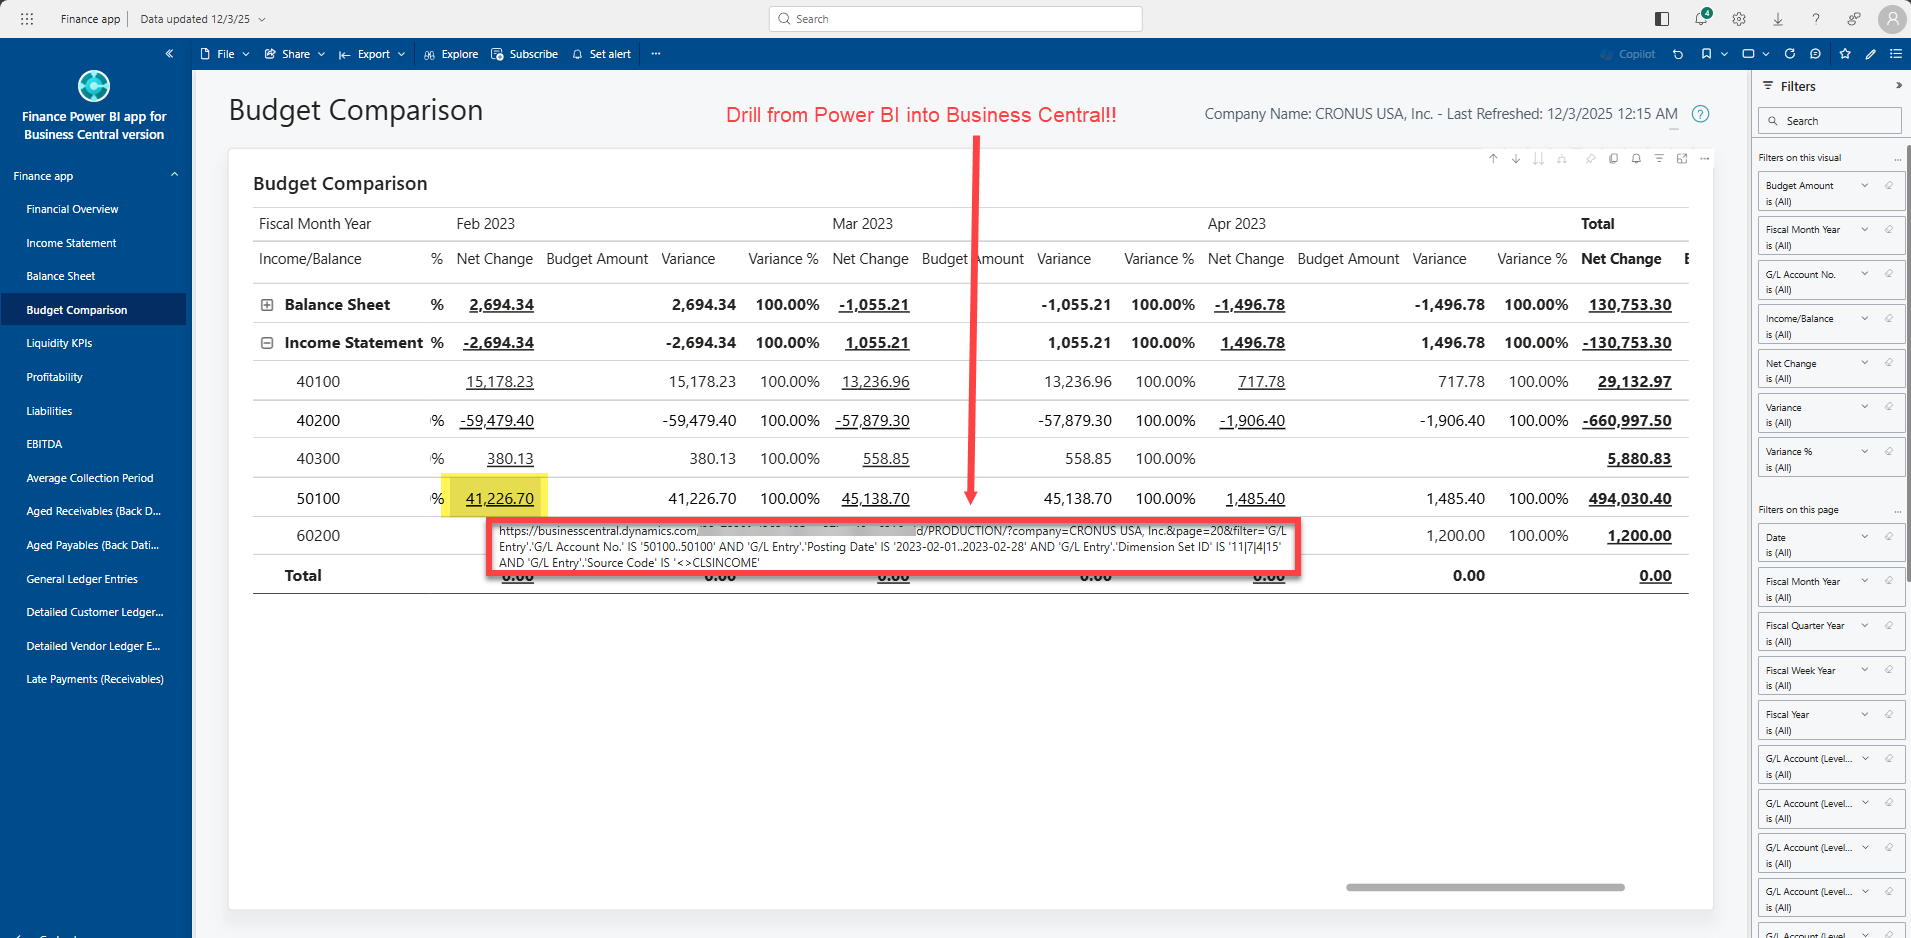
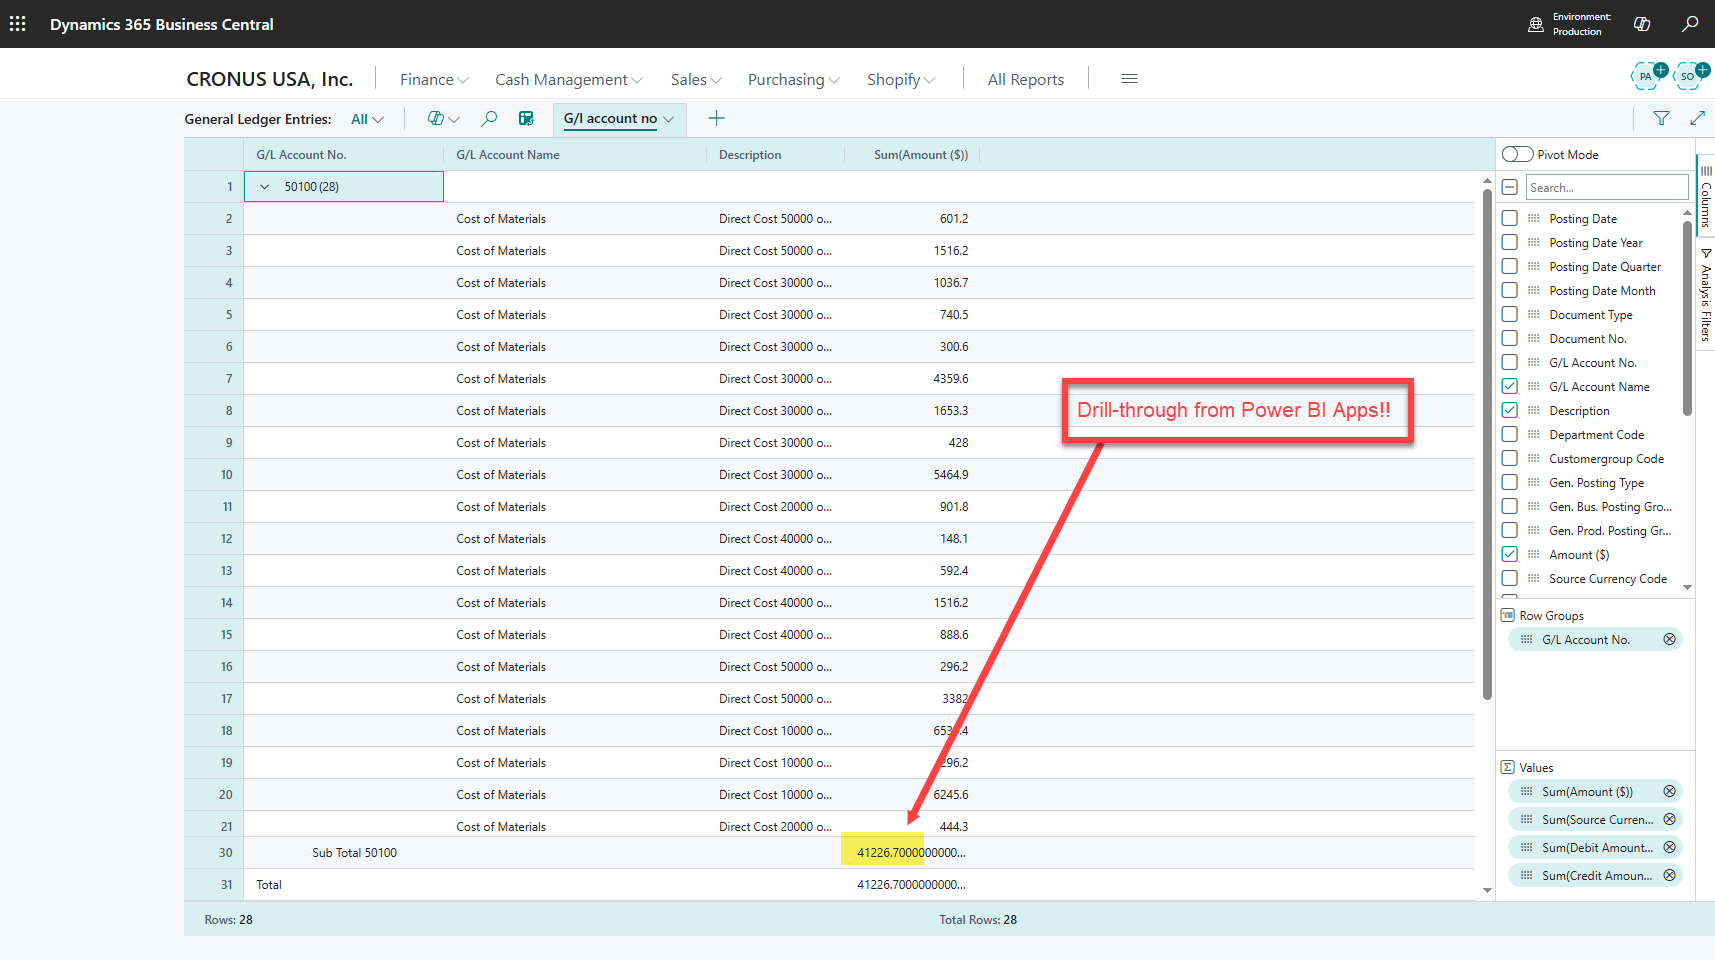
The newest – and probably coolest new feature within these updated Power BI app reports for end users is the Drillback into Business Central capability. Imagine how nice it will be for you now, navigating through your Power BI dashboards, stumbling across a number, and drilling right into a Business Central list page that backs up the number you inquired about! From there, you can natively drill into individual documents, continue using Analysis Mode, or even just export the data to Excel from the standard list page.
Finance App v27
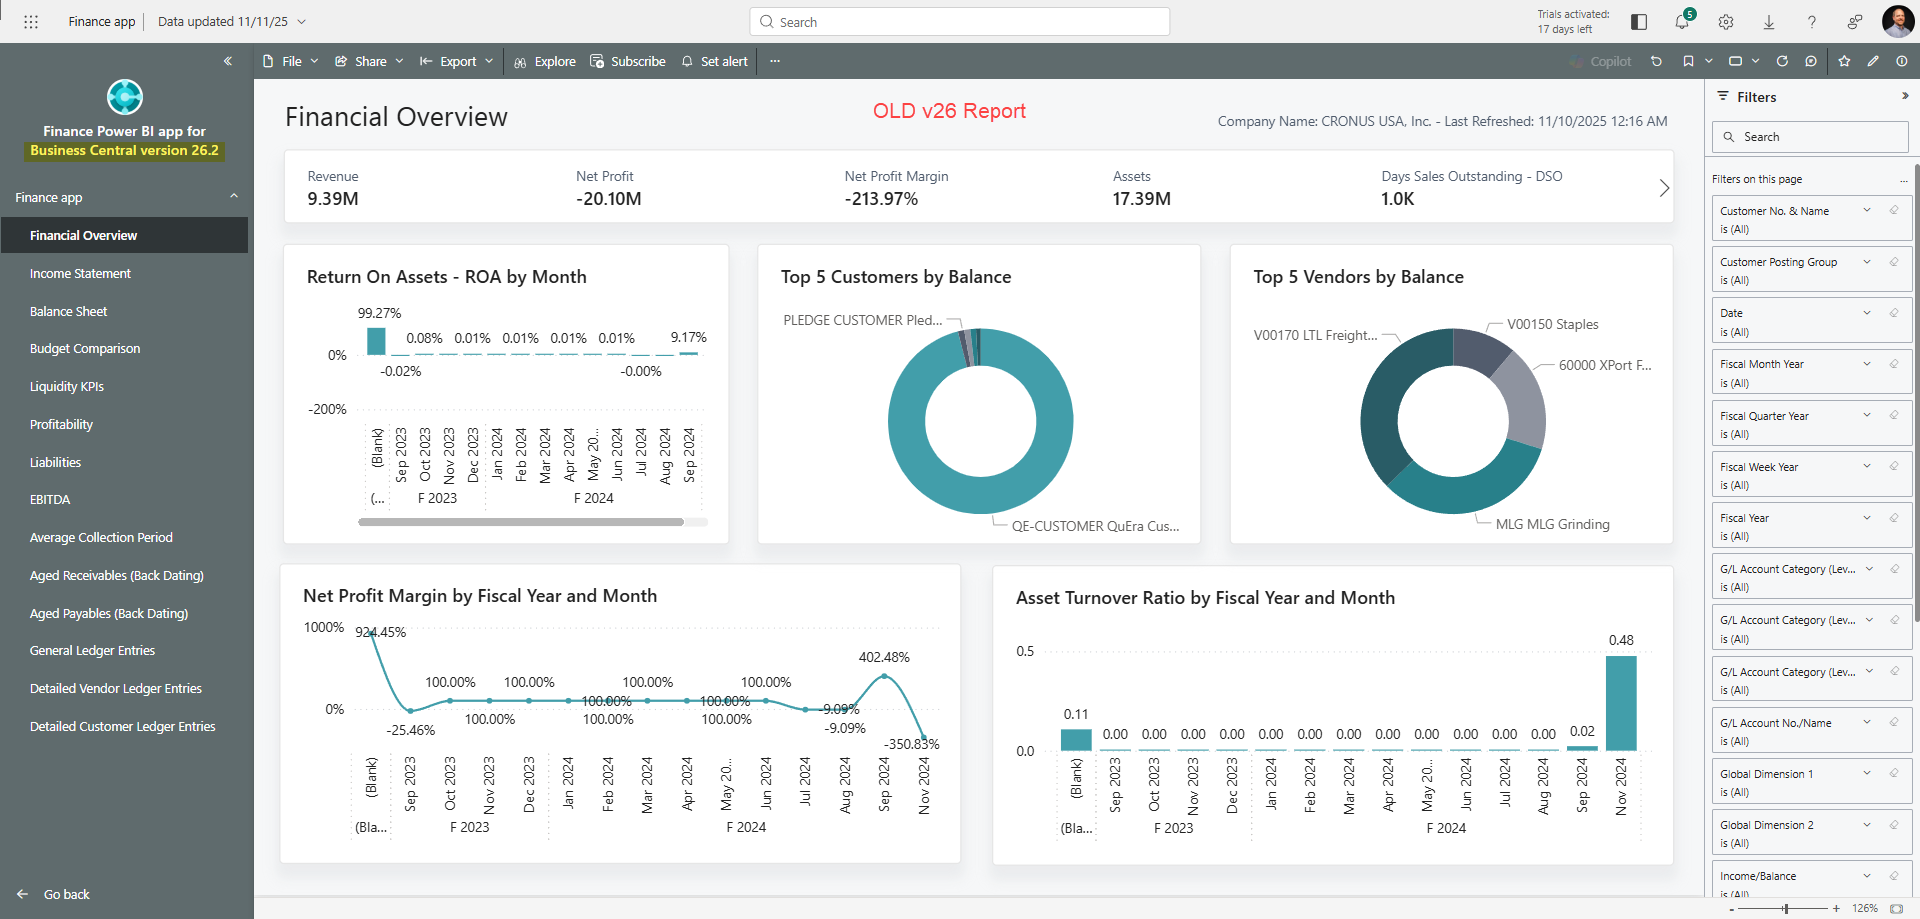
My initial observation between the older and newer Finance App reports is that the financial dashboard has changed most notably from gray to blue in the Navigation Pane when using the published app.
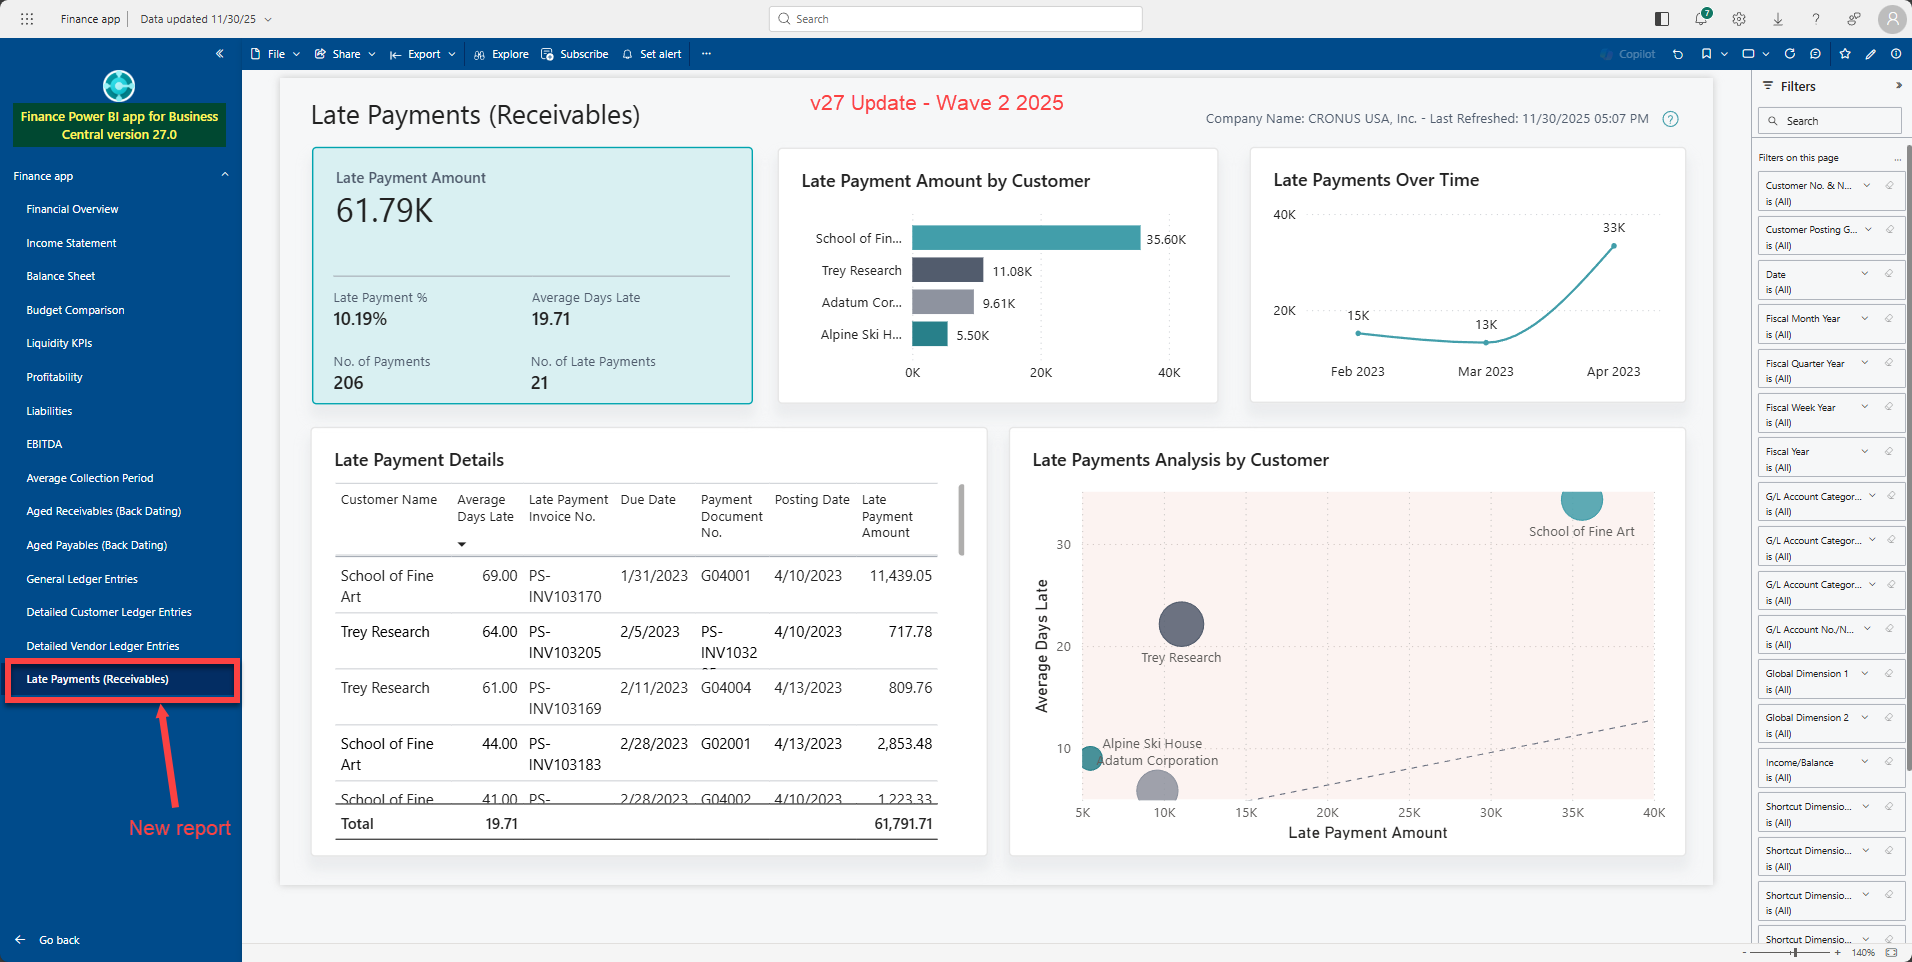
There is a net-new report called Late Payments for Receivables, which provides some insights into customer and payment trends.
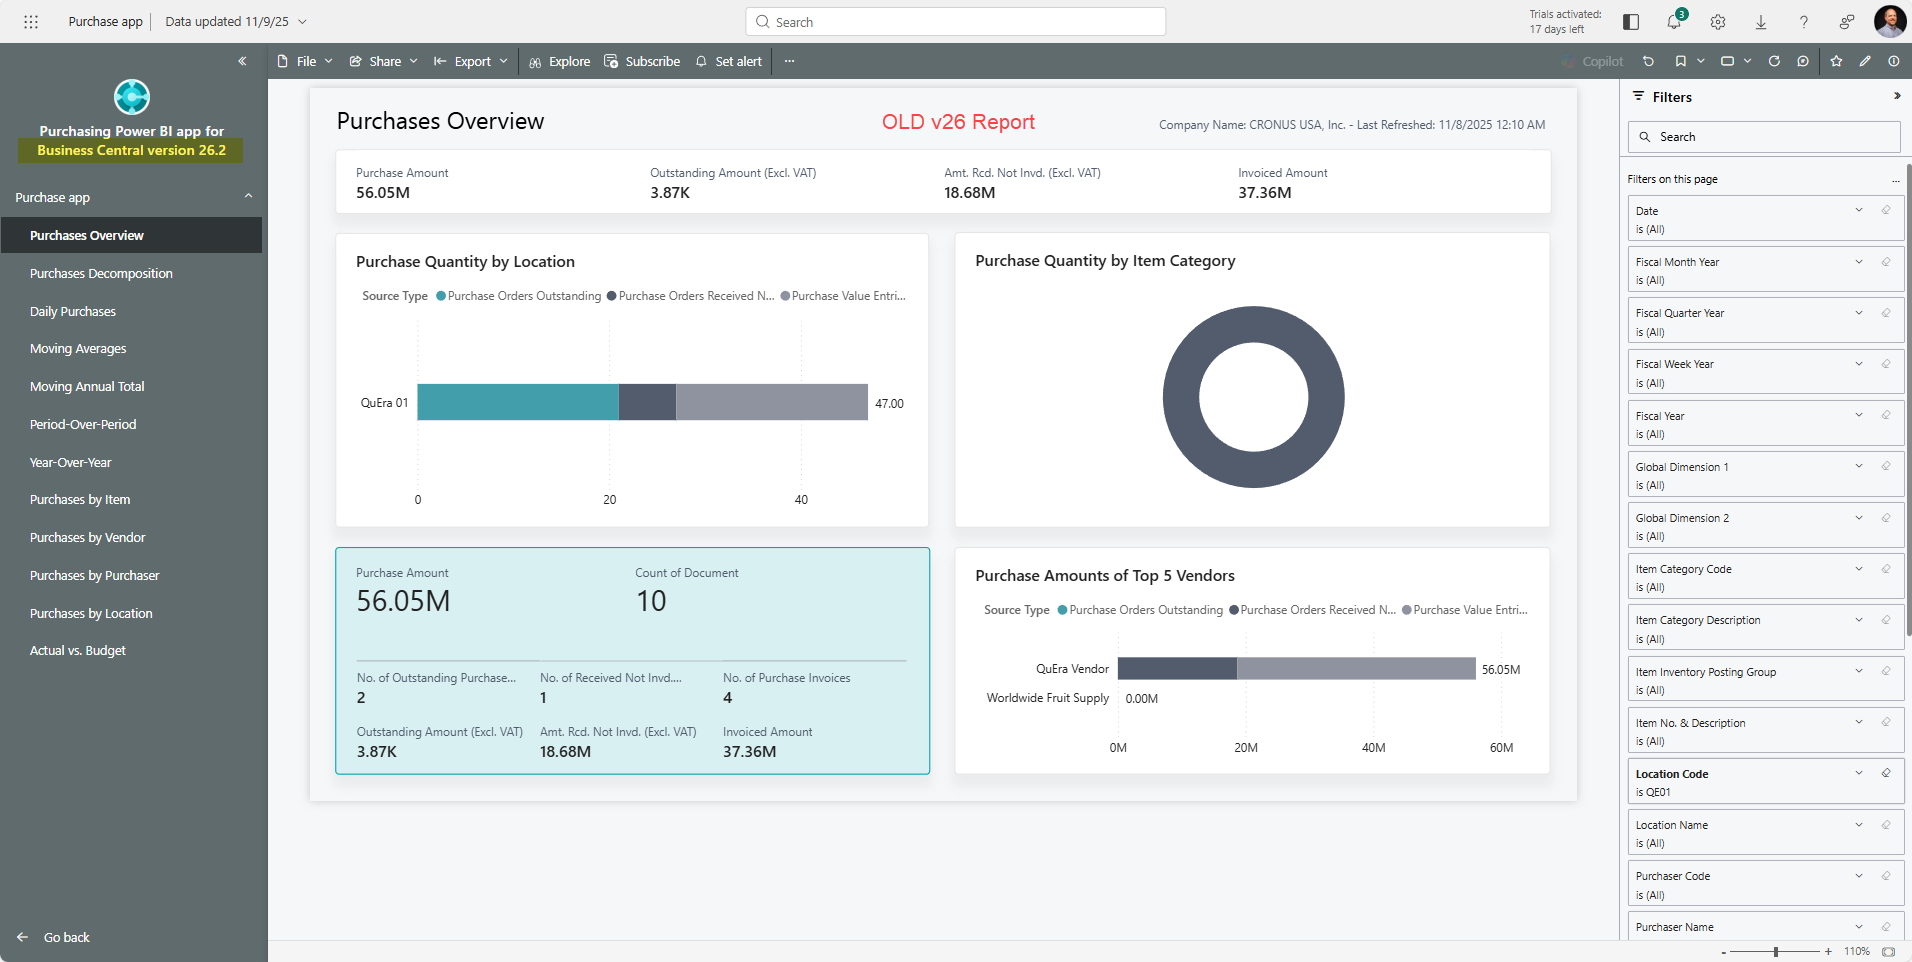
Purchasing App v27
A flashback comparison to the old v26 Purchase App reports (in grey) vs the new v27 reports (in blue) shows the Purchase app getting five net-new reports.
One of the five new reports monitors Purchase Return information for Items and Vendors.

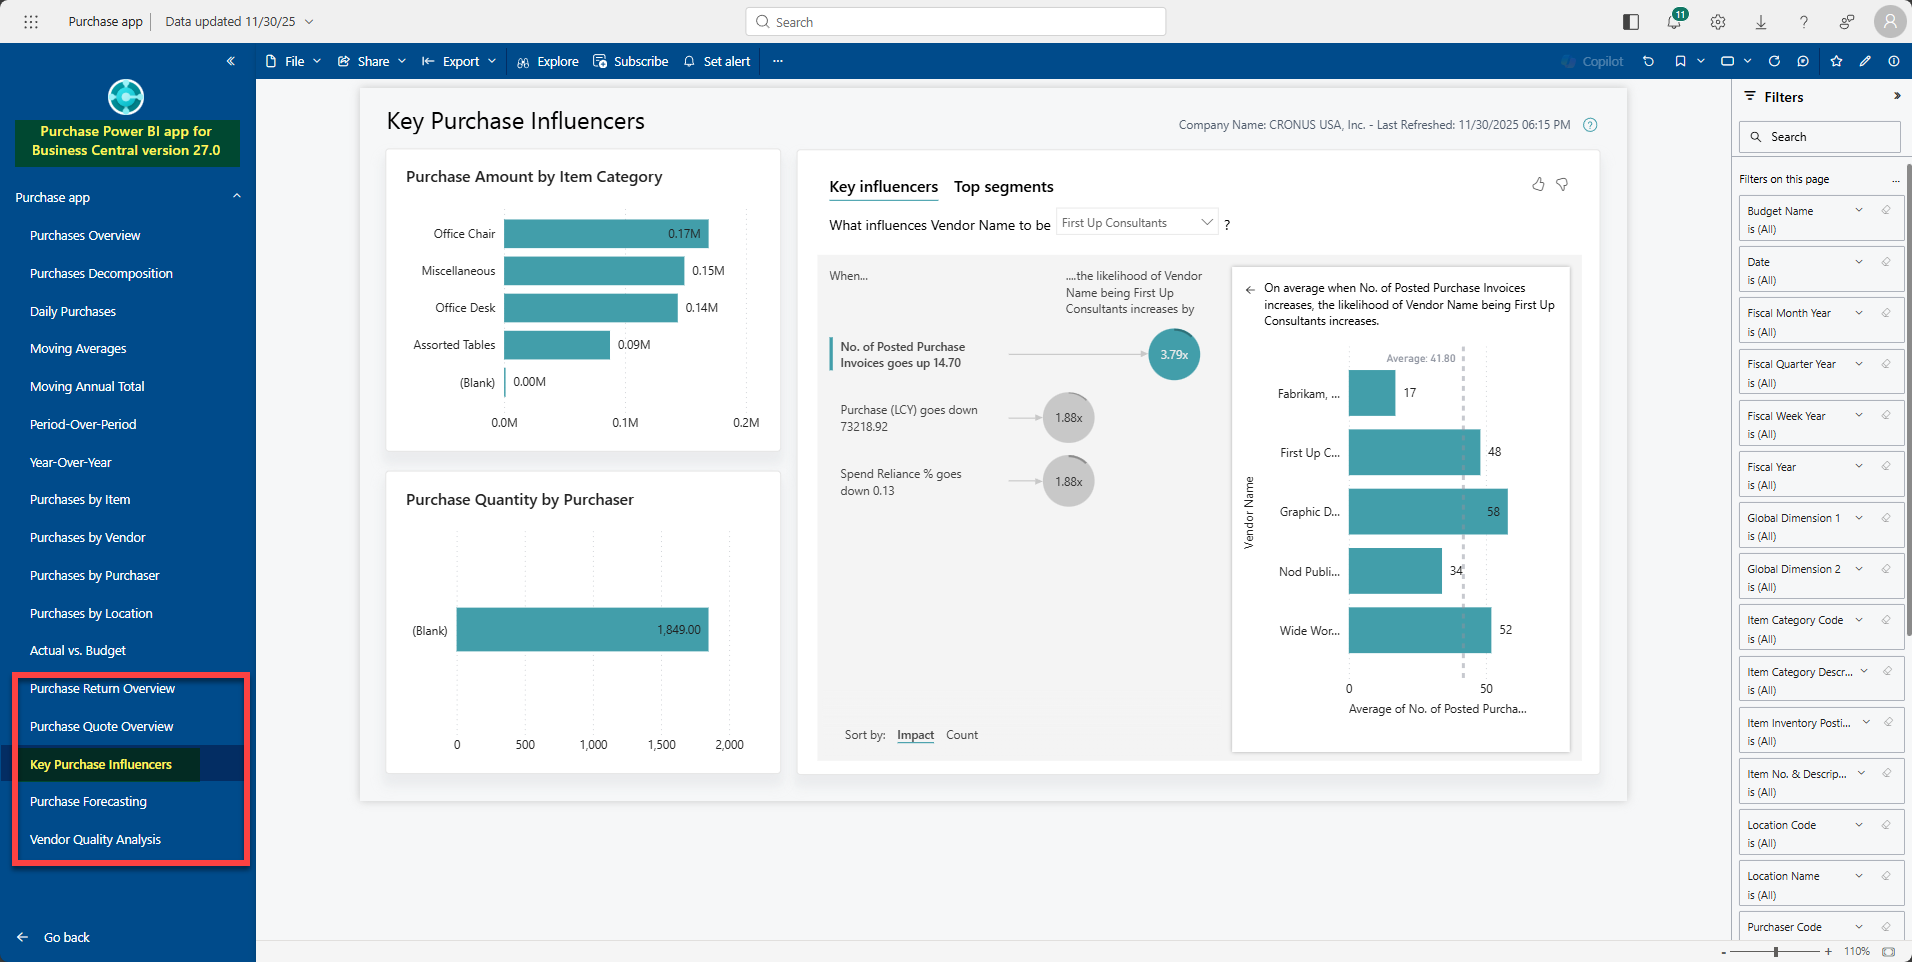
Another new dashboard, highlighting Key Purchase Influencers, shows some real promise for providing insights into buying behavior, especially when connected to your good data set! The Cronus data does not often align perfectly to make every point, but that’s really the magic behind all these Power BI App Reports! Once connected to your data, the model does the work, and your data tells the story, which helps you make better decisions in real-time!
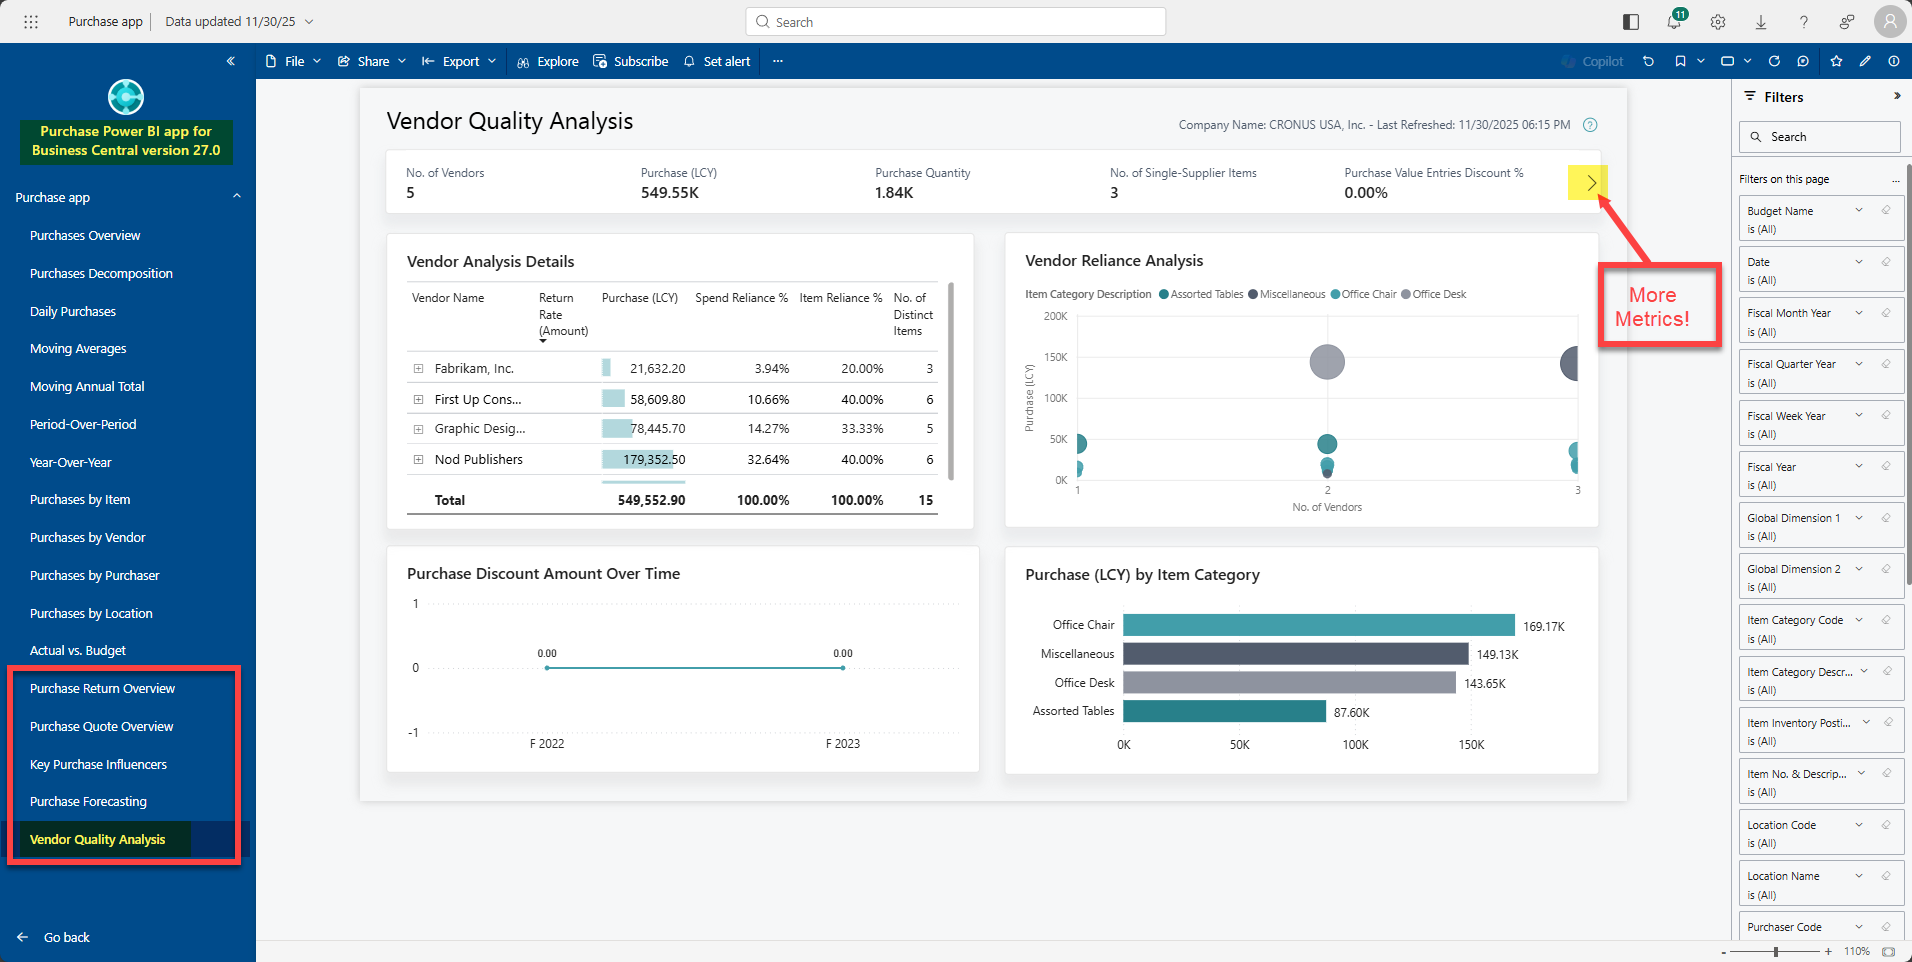
The Vendor Quality Analysis report is designed for monitoring vendor performance using metrics and data points, which provide the beginning of an analysis platform for reporting on vendor relationships.
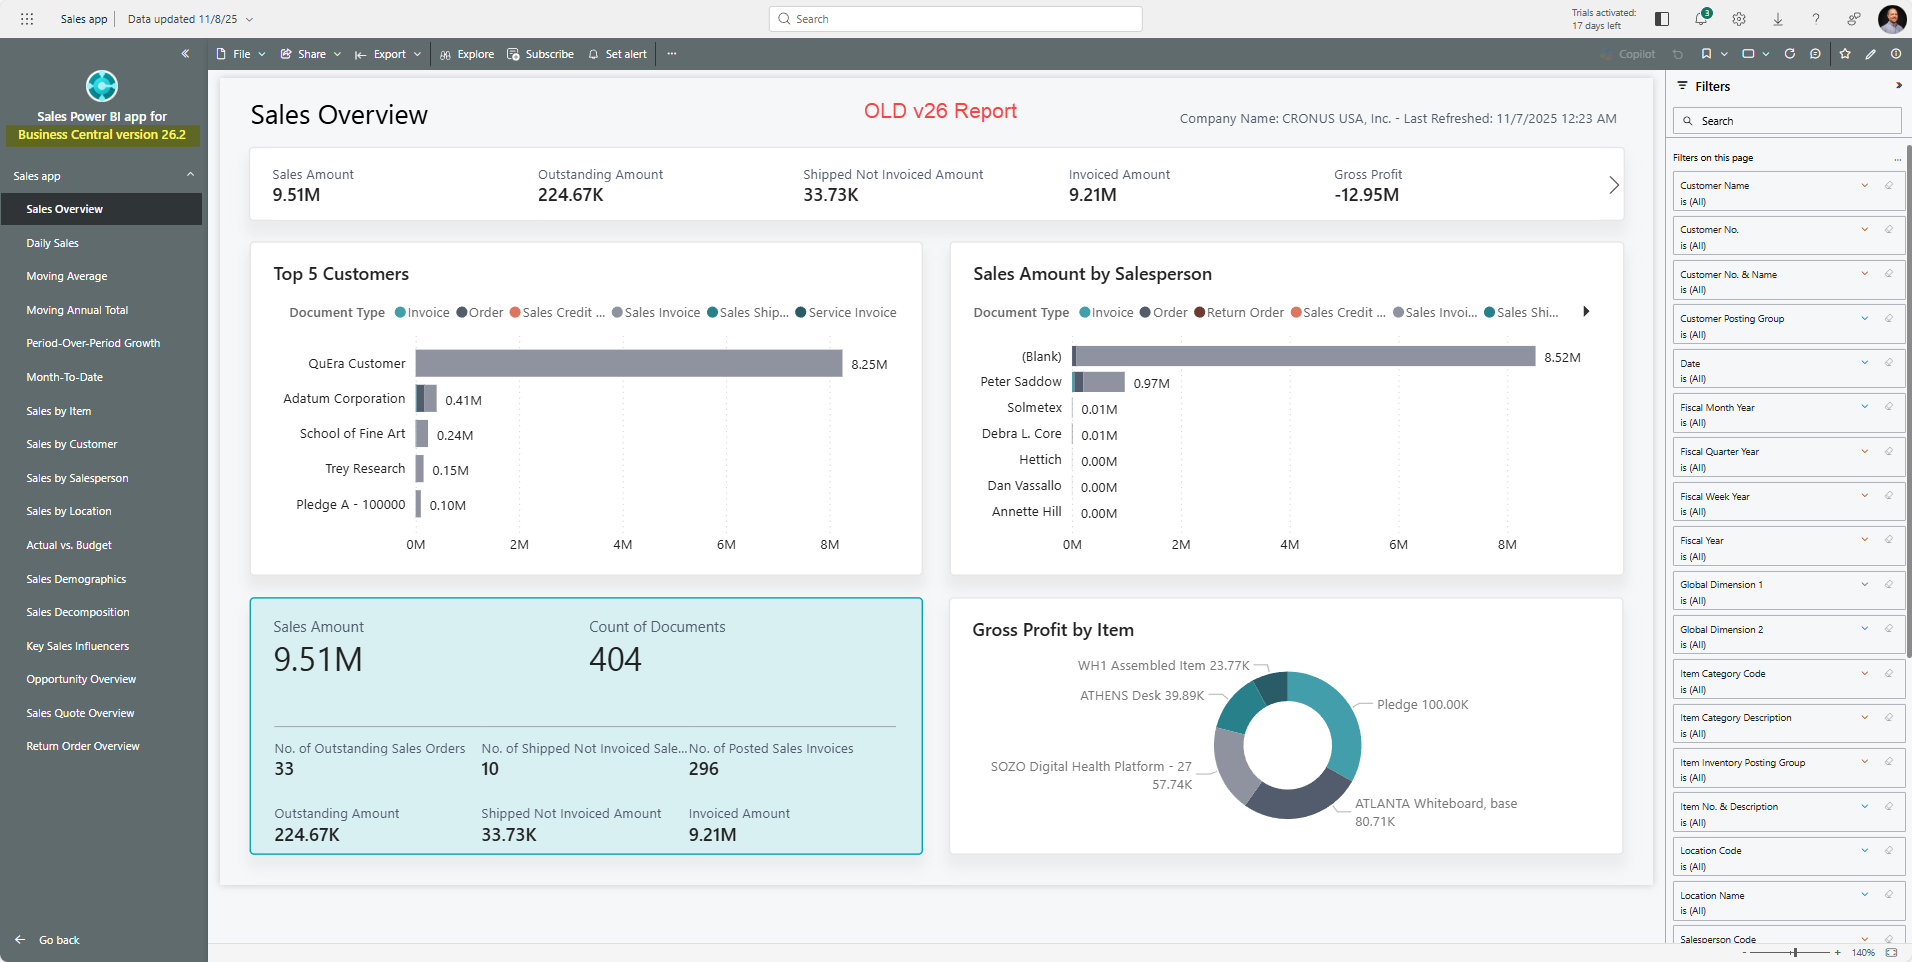
Sales App v27
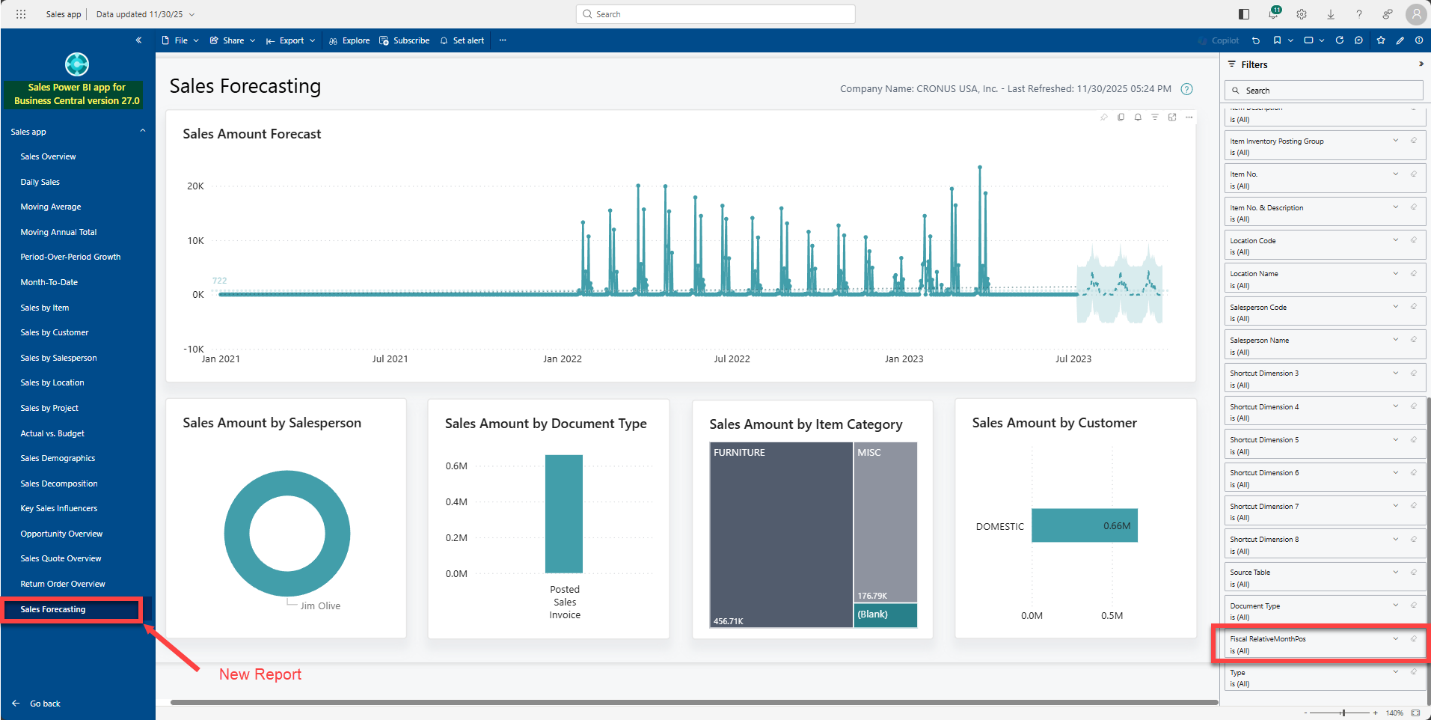
A flashback comparison to the old v26 Sales App reports (in grey) vs the new v27 reports (in blue) shows we also get another net-new report called Sales Forecasting.
A filter appears on the Sales Forecasting page when it initially opens, under Fiscal RelativeMonthsPos. Adjust or remove this to open the data on the page for further analysis and review. Your data, once connected, would provide more relevant visuals within the dashboard.
Looking Beyond the Dashboards
Using these free Power BI dashboards for Business Central at face value is only the start of the process of maximizing their capability for your users. As you learn more about the insights provided by these dashboards, you’ll have more of a desire to create Subscriptions, which inform you proactively using a predetermined frequency what the dashboards are displaying on specific pages. Or perhaps an Alert is more appropriate, which is a real-time notification indicating a specific scenario has occurred in Business Central.
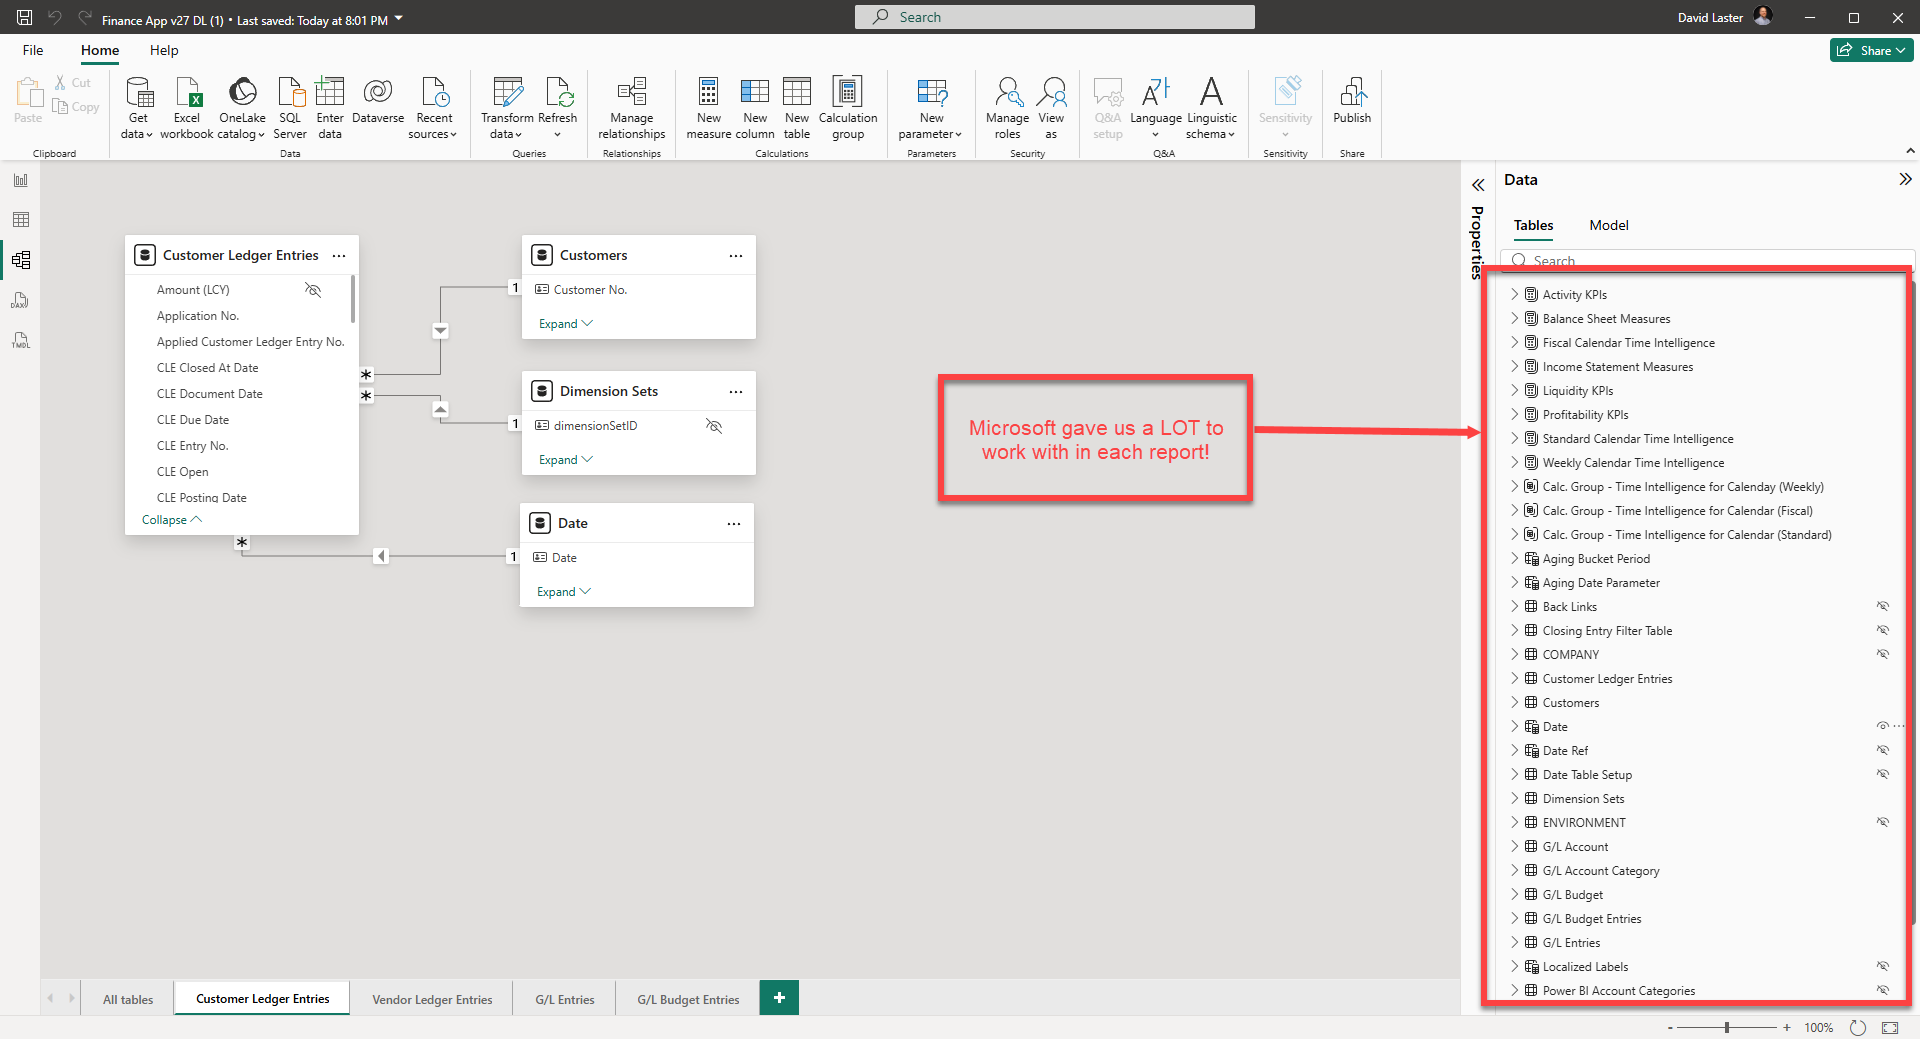
The analyical model alone, which comes built into the report, has taken a sigficant level of investment, and can be leveraged to kick-start any Power BI novice user who wants to build their own reports. Microsoft went about not only showing some nice dashboards to us in the app, but the measures, date tables, data dources, calculations, table joins, translations, etc. are accessible to us to use on our own. The open-source nature of these Power BI apps makes it easy for us save a copy, and then download the actual *.pbix file to your own desktop and add new pages and reports.
New Year, New Opportunities
Ready to unlock the full potential of your business data? Dive into the v27 Power BI App Reports today – connect your data, explore new dashboards, and take advantage of advanced analytics to transform your decision-making and access to information. Start customizing, setting up proactive alerts and subscriptions, and empower your team with insights that drive actual results. The next level of business intelligence is at your fingertips.
