
Power Platform
Public Group
Active 10 hours ago
Power Platform
Organizer:
- JOSE Organized by
-
-
Total Up a calculated column in Power BI
-
Total Up a calculated column in Power BI
Posted by sam-duval on October 10, 2019 at 8:42 am-

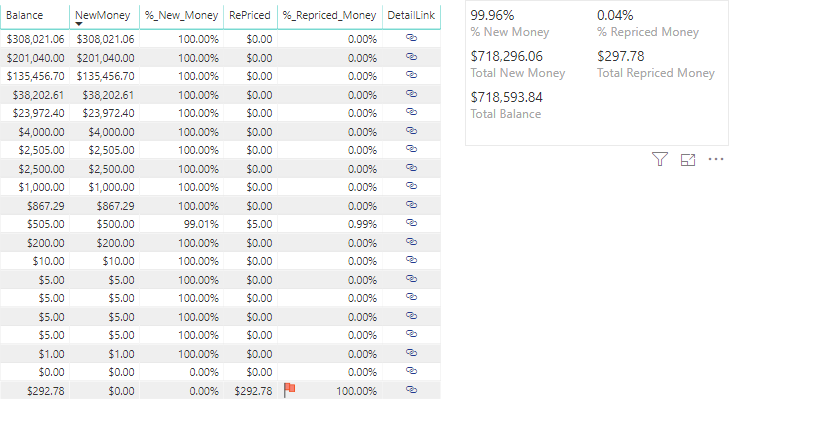
I have a column that I created for “% New Money” which is New Money divided by Balance. The calculation works perfectly at the row level, but how do I get it at the total level?
It should be 99.96% New Money and 0.04% Repriced
Thanks!
——————————
Sam Duval
Data Quality Analyst
Indianapolis
—————————— -

Vishesh Jain
MemberOctober 11, 2019 at 7:47 AM
Hi ,I wanted to know if creating a calculated column is a necessity ?and if you can try making a measure instead.
You can sum the New money columns and the Balance columns using the SUM() function and then divide both of them this should give you the result.
I think it might not be possible to sum the column that you created probably because it is in percentage.
However, please try the above mentioned approach.
Hope this helps.
Thank you,
——————————
Vishesh Jain
Owner
VR Construction
——————————
——————————————- -
Yes measure did the trick?. Strange that PBI can’t interpret the column type and do it no matter what. I ended up creating a dax summary table (for the totals) and rendering it into a multi row card But thanks for the tip on column vs measure, good to know for future reference.
——————————
Sam Duval
Data Quality Analyst
Indianapolis
——————————
——————————————- -
Vishesh Jain
MemberOctober 11, 2019 at 8:11 AM
HiDo you mind sharing your code and a screenshot of your visual.
Your approach?? is intriguing.
Thank you,
——————————
Vishesh Jain
Owner
VR Construction
——————————
——————————————- -
Not sure how well this would work if I was to have more granular filtering, but for the purpose of this report, it works.Totals = SUMMARIZE(Helium_Savings_Query,Helium_Savings_Query[Data_As_Of].[Date],Helium_Savings_Query[ProfileGroup],”Total Balance”,sum(Helium_Savings_Query[Balance]),”Total New Money”,sum(Helium_Savings_Query[NewMoney]),”Total Repriced Money”,sum(Helium_Savings_Query[RePriced]),”% New Money”,DIVIDE(SUM(Helium_Savings_Query[NewMoney]),sum(Helium_Savings_Query[Balance]),0),”% Repriced Money”,DIVIDE(SUM(Helium_Savings_Query[RePriced]),sum(Helium_Savings_Query[Balance]),0))
——————————
Sam Duval
Data Quality Analyst
Indianapolis
——————————
——————————————- -
Vishesh Jain
MemberOctober 12, 2019 at 3:45 AM
Hi ,Is it possible for you to share a sample file??
Knowing your data model will give me a better understanding of the code.
Also I saw in your code you have used ‘.[Date]’ in this section Helium_Savings_Query[Data_As_Of].[Date]
I am assuming that you don’t have a calendar table in your data model and are using the underlying date table.
Any particular reason for this approach, since generally you should have a calendar table in your data model?Would really appreciate your insights.
Thank you,
——————————
Vishesh Jain
Owner
VR Construction
——————————
——————————————- -
the data model is extremely simple. The helium savings and The summary table.
The work in building this report/data model is all built and stored in SQL as a stored procedure. My team is pretty well versed in reading writing SQL, and for the most part it’s easier/faster to have sql do the heavy lifting and pass the end result back to power bi.
So the Helium_Savings_Query you are asking about is the stored procedure results that are imported. The summary table is created via the dax summarize function and is creating a summary so that I could display the totals before you suggested measures vs columns.
I don’t have a calendar table because the data is always the previous day as determined In sql. It’s pushed forward into PBI report for the purposes of showing the end user that the report has updated for the day
——————————
Sam Duval
Data Quality Analyst
Indianapolis
——————————
——————————————- -
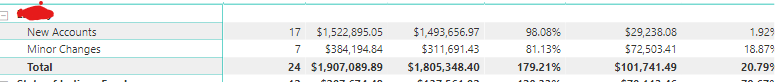
Want to ping your expertise again, I have a pivot table in power Bi that i’m trying to show the “new money” both as a total for a group and subsquently show it at two different more granular levels. Is it possible to have a total row that calculates independently of the individual detail rows? For the attached example, the total new money should be 94.67% instead of the 179.21% shown
?
——————————
Sam Duval
Data Quality Analyst
Indianapolis
——————————
——————————————- -
Audrey Abbey
MemberOctober 28, 2019 at 10:19 AM
Hi Sam,Need to see the calculation that produces the 98.08% and 81.13% values.
Changes are, you just need to need to wrap the calculation in an IF that will use the detail calculation for lines, and a summary calculation for the total.
IF(HASONEVALUE(NameofColumnUsedOnRows), [DetailCalculation], [SummaryCalculation])That will detect detail lines vs summary line, and override the calculation used on the total line.
I use this a lot to show an average on the total line instead of a sum, for example.However, you may also just be able to update the calculation so that it works without the IF.
Depends on how your data is modeled and your existing calculations though.——————————
Audrey Abbey
SR. BI Developer/Analyst
LeapFrogBI
Portland OR
——————————
——————————————- -
Thanks I
ll give the if function a try. I had to create a summary table via DAX to roll up their totals from a person to their higher grouping and get the correct % percentages. Might be a better way to do that as well, but for now the summarize does the trick. Within the summarize table, this is the equation:“% New Money”,DIVIDE(SUM(Helium_Savings_Query[NewMoney]),sum(Helium_Savings_Query[Balance]),0)?
——————————
Sam Duval
Data Quality Analyst
Indianapolis
——————————
——————————————- -
Vishesh Jain
MemberNovember 1, 2019 at 1:46 AM
Hi ,I’ll need to have a look at your file to try to come up with a solution.
Meanwhile please can you tell us if the column which contains the values 98.08% and 81.13%? is a calculated column or not?
If this was a measure, it would have calculated 94.67% automatically.Please let me know what am I missing here.
Thank you,
——————————
Vishesh Jain
Owner
VR Construction
——————————
——————————————- -
thanks Measures were the culprit again (or lack thereof) I did the calculation of % new money in the power query editor not via dax inside the model. I guess with power bi were/how you create a column makes a huge difference in whether or not it works as you’d expect.?
——————————
Sam Duval
Data Quality Analyst
Indianapolis
——————————
——————————————- -
Vishesh Jain
MemberNovember 4, 2019 at 3:19 AM
Hi ,Yes it definitely makes a huge difference where and how you create extra columns.
From a performance stand point, you should only create a column if you need it, else if things are calculation based, then you should try to use a measure.
Measures are faster and dynamic.
On the other hand calculated columns will bloat up your data model and affect refresh times as well.Hence, use measures as much as possible, especially when you need to calculate numbers.
Thank you,
——————————
Vishesh Jain
Owner
VR Construction
——————————
——————————————- -
Is there a dax function that would flag every one who has a specified value? I’m working on a different report in which i’m wanting to exclude people who have a selected item. I want to remove the person if they have x item regardless of what else they have.
I have the following example data and I want to exclude everyone with a Phone. Normal slicer behavior I deselect phone from the list, but all 4 people still get included in the visuals because they have something besides a phone. I’m wanting to construct a measure combination using selectedvalue dax function that would remove person a from the equation while still including persons B-D. I’ve concocted a power apps/flow power bi direct query combination that does the trick, but wondering if this could be done solely within power bi
PersonID ItemOwned A Phone A Tablet A Laptop B Tablet B Laptop B Desktop C Tablet C Laptop D Laptop ——————————
Sam Duval
Data Quality Analyst
Indianapolis
——————————
——————————————- -
Vishesh Jain
MemberNovember 5, 2019 at 1:31 AM
Hi ,***EDIT***
I have hardcoded the value ‘Phone’ in the Calculated Column. So this approach will not be dynamic.We will have to go all measure somehow, for this to be dynamic.
***EDIT END***
Please can you have a look at the attached file.
I added a calculated column, defined a measure and then put the measure as the filter on the filter pane.
Please let us know if this solution works for you.
I am trying to go all measure based and remove that calculated column, but in the meanwhile this should get you up and running and the calculated column should not really bloat up your model either.
Hope this helps.
Thank you,
——————————
Vishesh Jain
Owner
VR Construction
——————————
——————————————- -
Vishesh Jain
MemberNovember 5, 2019 at 7:05 AM
Hi ,I was able to get it all measure based, but it is still not as dynamic as you would want it to be. You will not be able to select the value from the slicer, but you can always change the value from the code itself or add multiple values to the “IN” part of the first measure.
Meanwhile, please add these 2 measures to the previous file and then add the measure EXCL to the visual level filter and then set the filter value to be 0.
Here are the 2 measures and I am attaching my file as well.
Measure_Exclude =
Var new_table = ADDCOLUMNS('Table',
"@EX", IF('Table'[ItemOwned] IN {"Phone"} ,1,0)
)
var new_sum = SUMX(new_table,[@EX])
Return
new_sum?

--------------------

EXCL = CALCULATE([Measure_Exclude], ALLEXCEPT('Table', 'Table'[PersonID]))
This way, at least we have eliminated the calculated column, in case your data model, does not allow you to define one.
Thank you,
——————————
Vishesh Jain
Owner
VR Construction
——————————
——————————————- -
Thanks I was able to come up with a similar method using calculated columns, significantly more bloated then your solution, so i’m looking forward to digesting it for future reference, so thanks for trying! ?If we put selected value into a variable in your latest example and then passed that variable to the excl expression would that work?
Measure_Exclude =
var myselectedvalue=selectecvalue…
Var new_table = ADDCOLUMNS(‘Table’,
“@EX”, IF(‘Table'[ItemOwned] IN {“myselectedvalue”} ,1,0)
)all else fails i might have to sit on this until next years power apps summit and bring it to the ask the experts area.. There has to be a method or an idea floating around the heads of the developers to build something like this.
——————————
Sam Duval
Data Quality Analyst
Indianapolis
——————————
——————————————- -
Vishesh Jain
MemberNovember 6, 2019 at 2:25 AM
Hi ,I tired the variable and SELECTEDVALUE() function but it did not work.
If and when you are able to find a solution to this kindly share it with the community.
Thank you,?
——————————
Vishesh Jain
Owner
VR Construction
——————————
——————————————- -
Gopa Kumar Sivadasan
MemberNovember 7, 2019 at 9:26 AM
HiPlease see if the following helps you with regard to the issue of excluding people with deselected item/s in a slicer.


?The DAX for the indicator measure is below:
Exclusion Indicator =
------------------------------------------
//find the excluded items in the slicer
VAR __SelectedItems =
    VALUES ( 'Item Master'[Item] )
VAR __ExcludedItems =
    CALCULATETABLE (
        VALUES ( 'Item Master'[Item] ),
        ALL ( 'Item Master' ),
        NOT ( 'Item Master'[Item] IN __SelectedItems )
    )
-----------------------------------------
//find the itemsowned by each person ignoring any filters on the item
VAR __rlvntable =
    CALCULATETABLE (
        VALUES ( Table1[ItemOwned] ),
        ALLEXCEPT ( Table1, Table1[PersonID] )
    )
-----------------------------------------
//find the items which are excluded in the slicer but is also owned by each person.
VAR __rlvntable2 =
    INTERSECT ( __ExcludedItems, __rlvntable )
-----------------------------------------
RETURN
    //if the excluded items are not owned by the person, then put the value as 1
    IF (
        ISEMPTY ( __rlvntable2 ),
        1,
        0
    )
?
?
PFA the pbix file for your reference.???——————————
Gopa Kumar
Limner Consulting
——————————
——————————————- -
Wow… It’s going to take me a minute to digest and understand the steps involved to get to this point, but it looks a least in your example like you’ve solved my problem. I’ll copy your logic into my actual model and see if it holds up with real data. Either way this looks more promising than anything i’ve found so far!?
——————————
Sam Duval
Data Quality Analyst
Indianapolis
——————————
——————————————- -
Vishesh Jain
MemberNovember 8, 2019 at 2:06 AM
Hi ?,First of all that was some awesome DAX!
If you don’t mind please can you explain this part of your code. I was not able to figure out how the NOT() function was working here.
VAR __ExcludedItems =CALCULATETABLE (VALUES ( ‘Item Master'[Item] ),ALL ( ‘Item Master’ ),NOT ( ‘Item Master'[Item] IN __SelectedItems )) Thank you,——————————
Vishesh Jain
Owner
VR Construction
——————————
——————————————- -
Gopa Kumar Sivadasan
MemberNovember 8, 2019 at 4:19 AM
HiThe NOT basically makes the statement within as FALSE. So, the filter within (‘Item Master'[Item] IN __SelectedItems)) we are saying are for items checked in the slicer. Hence, the NOT makes that statement FALSE and derives the items not checked from the underlying table. ?
——————————
Gopa Kumar
Limner Consulting
——————————
——————————————- -
I’ve attached the working version of what I am doing, sanitized due to the nature of the data, but the core structure is there. I believe I copied your measure and updated to fit my model but it doesn’t seem to work. not sure if i’m missing something or they added layer of historical data changes how the measure works.??
——————————
Sam Duval
Data Quality Analyst
Indianapolis
——————————
——————————————- -
Gopa Kumar Sivadasan
MemberNovember 8, 2019 at 1:22 PM
HiPlease see if the following corrections helps you.

?…

If not, please let me know.
——————————
Gopa Kumar
Limner Consulting
——————————
——————————————- -
Thanks i made your changes, and it’s filtering the list but perhaps filtering it to much now. I don’t want to remove the entire membership group desc, just the member_Agree_nbr that are associated with the indirect. Which for eom_prod_dt of 10/31/2019 should remove about 18.188 people ?.
Is there a way to manipulate the Members measure in the Member Details that makes it work more like a count if type scenario?
——————————
Sam Duval
Data Quality Analyst
Indianapolis
——————————
——————————————- -
Gopa Kumar Sivadasan
MemberNovember 8, 2019 at 1:53 PM
HiI am sorry but I have not fully understood your requirement. Is it possible for you to explain with an example??
——————————
Gopa Kumar
Limner Consulting
——————————
——————————————- -
I’ll try. if I look count of members by Alternate ALM filtered for country of united states and eom prod date of 10/31/2019 I get a count of 18,188 distinct member _agree_nbrs. Those 18,188 members are grouped together by the various company they work for. Our entire membership for October 2019 was 108,967 i’m trying to devise a way the filter the membership count so that if I choose to exclude indirect auto loans from the slicer those 18,188 are removed from the membership totals leaving me with a total count of 90,779. Based on the measure you’ve come up with, my visual reduces down to 1,587 total.
I was able to do it with calculated columns and dax tables. but that required a dataset to refresh before the changes would be applied.
I basically created a couple different tables:
column: MbrDateKey = Members_Details[MEMBER_AGREE_NBR]&Members_Details[EOM_PROD_DT]
column: membercounter =1ALM_Exclusion_Table = FILTER(Members_Details,Members_Details[Alternate_ALM]=”Auto Loans-Indirect”)
Calculation_Remove = GROUPBY(ALM_Exclusion_Table,ALM_Exclusion_Table[MbrDateKey],ALM_Exclusion_Table[MemberCounter],ALM_Exclusion_Table[StateCountryDate],ALM_Exclusion_Table[EOM_PROD_DT])Calculations = GROUPBY(Members_Details,Members_Details[MbrDateKey],Members_Details[MemberCounter],Members_Details[StateCountryDate],Members_Details[EOM_PROD_DT])Table = EXCEPT(‘Calculations’,Calculation_Remove) The resulting number of records in calculations remove, is exactly what I was expecting to see. I’m now trying to figure out how I can do this with measures to be able to calculate “on the fly” without requiring dataset refreshes to see the different selections.Your DAX is on the right track, I’m just not sure how to expand upon your work to fit this exact model.
Thanks for your help so far, i’ve learned alot of you and
??
——————————
Sam Duval
Data Quality Analyst
Indianapolis
——————————
——————————————- -
Gopa Kumar Sivadasan
MemberNovember 9, 2019 at 2:25 AM
HiPlease change back the code to avoid filter on the column [MEMBER_AGREE_NBR] as below:

?
And change the visual to Matrix and add the field [MEMBER_AGREE_NBR] to it: The visual will give a figure of 87046 count against your calculation of 90779 for exclusion of ‘Auto Loans-Indirect’. Based on your requirement mentioned earlier:
QUOTE
…I want to remove the person if they have x item regardless of what else they have.
UNQUOTEI am not sure whether your calculation of 90779 is correct. If we take an example of Allied Solutions Group, based on the way you have done the calculation, the count will come to 1051. However, the visual will give only 1050. Because [MEMBER_AGREE_NBR] 73242 has two records with [Alternate_ALM] values ‘Auto Loans-Indirect’ and ‘Savings’. Hence, in your calculation when you filter out ‘Auto Loans-Indirect’, the row for ‘Savings’ will remain whereas in the new measure both the records will be removed. Hope this clarifies. If still you have issues, let me know.
PFA the pbix file with the above changes.
——————————
Gopa Kumar
Limner Consulting
——————————
——————————————- -
Thanks I will definitely check it out. It’s possible you might be correct in the counts I will verify the counts on the sql server. Thanks for the help
——Original Message——
Hi
Please change back the code to avoid filter on the column [MEMBER_AGREE_NBR] as below:
?
And change the visual to Matrix and add the field [MEMBER_AGREE_NBR] to it:The visual will give a figure of 87046 count against your calculation of 90779 for exclusion of ‘Auto Loans-Indirect’. Based on your requirement mentioned earlier:QUOTE
…I want to remove the person if they have x item regardless of what else they have.
UNQUOTEI am not sure whether your calculation of 90779 is correct. If we take an example of Allied Solutions Group, based on the way you have done the calculation, the count will come to 1051. However, the visual will give only 1050. Because [MEMBER_AGREE_NBR] 73242 has two records with [Alternate_ALM] values ‘Auto Loans-Indirect’ and ‘Savings’. Hence, in your calculation when you filter out ‘Auto Loans-Indirect’, the row for ‘Savings’ will remain whereas in the new measure both the records will be removed. Hope this clarifies. If still you have issues, let me know.
PFA the pbix file with the above changes.
——————————
Gopa Kumar
Limner Consulting
——————————
——————————————- -
Smart idea using the matrix I hadn’t considered nesting the member number into the visual like that for purposes of filtering, I’ve repointed the file to the production SP and your logic checks good, I am able to get the same results in power bi that I can in SQL server. I’m going to have to study the mechanics of this filter and re-purpose it in future. Thanks for sticking with me and helping make this happen.
? See Gopa’s previous post above, the attached file appears to be the working model.
——————————
Sam Duval
Data Quality Analyst
Indianapolis
——————————
——————————————- -
Vishesh Jain
MemberNovember 11, 2019 at 12:37 AM
Hi ,I saw the file and kudos on figuring out the solution!
Now you won’t have to wait for the Summit 😀
Thank you,
——————————
Vishesh Jain
Owner
VR Construction
——————————
——————————————- -
Gopa Kumar Sivadasan
MemberNovember 22, 2019 at 4:19 PM
HiAs requested in DM, please see if the following helps you with regards to showing values in the MAP visual.
In fact, the new measure is simpler and more efficient than the earlier one (based on the performance analyser). It also does not need any indicators and any explicit member number filter in the visuals.The DAX for the new measure:
?Exclusion Member Count = ------------------------------------------ //find the excluded items in the slicer VAR __SelectedItems = VALUES ( 'ALM_List'[Alternate_ALM] ) VAR __ExcludedItems = CALCULATETABLE ( VALUES ( 'ALM_List'[Alternate_ALM] ), ALL ( ALM_List ), NOT ( 'ALM_List'[Alternate_ALM] IN __SelectedItems ) ) ----------------------------------------- //create a list of members having the excluded items VAR __rlvntable1 = CALCULATETABLE ( VALUES ( Members_Details[MEMBER_AGREE_NBR] ), ALM_List[Alternate_ALM] IN __ExcludedItems, ALLEXCEPT ( Members_Details, Members_Details[MEMBER_AGREE_NBR] ) ) //create a list of members excluding those members who have the excluded items VAR __rlvntable2 = CALCULATETABLE ( VALUES ( Members_Details[MEMBER_AGREE_NBR] ), NOT ( Members_Details[MEMBER_AGREE_NBR] IN __rlvntable1 ) ) RETURN COUNTROWS ( __rlvntable2 ) ?PFA the pbix file with the revised visuals for your reference. Please let me know if this helps you.
——————————
Gopa Kumar
Limner Consulting
——————————
——————————————- -
Thanks I will give this a try. On “paper?” this looks to be exactly what I am after, and very similar to what I was able to create via calculated tables, but couldn’t figure out the measure based dax to replicate. I’ll post back once I’ve had a chance to implement and test out.
——————————
Sam Duval
Data Quality Analyst
Indianapolis
——————————
——————————————-
sam-duval replied 5 years, 11 months ago 1 Member · 0 Replies -
-
0 Replies
Sorry, there were no replies found.
The discussion ‘Total Up a calculated column in Power BI’ is closed to new replies.
