Table Visualization Not Showing Zeros
-
Table Visualization Not Showing Zeros
Posted by DSC Communities on June 10, 2019 at 7:13 pm-

Don Mill
MemberJune 10, 2019 at 7:13 PM
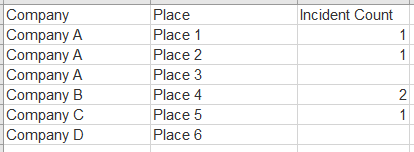
I have a table visualization on the canvas set up that currently looks like this:Company
Place
Incident Count
(Blank)
(Blank)
(Blank)
(Blank)
(Blank)
(Blank)
Company A
Place 1
1
Company A
Place 2
1
Company A
Place 3
(Blank)
Company B
Place 4
2
Company C
Place 5
1
Company D
Place 6
(Blank)
The table is not displaying zeros. I do have “Show items with no data” checked for both Company and Place. I think there are 2 problems: 1st) For Company A/Place 3 and Company D/Place 6 the places do not appear in the source data table. The company and place are pulled from a separate data table. For some reason, the incident count is not showing zero. The 2nd problem has to do with the first two rows. The first blank row is a sum of all rows below it. It should read All Companies, All Places, and Incident Count = 5. The second row is a sum of Company A for Places 1, 2, and 3. It should read Company A Sum, All Places, and Incident Count = 2. No matter what I do I cannot get it to show. Any suggestions on this? Been working on it for far too long. Thanks.
——————————
Don Mill——————————
-

Christian Eriksen
MemberJune 11, 2019 at 1:13 AM
Hi DonI have setup a scenario in Excel with a similar dataset to what you present in your example.

After linking this data to Power BI, I then create a calculated column as follows:New Incident Count = if(isblank(Sheet1[Incident Count]),0,Sheet1[Incident Count])
This creates a column that will replace blank values with a 0.
Once you have this column, you can use this instead of the original incident column.Rather than a table visual, I would propose you have a look at using the matrix visual (especially now that in the June 2019 version, you can change the labels of the totals).

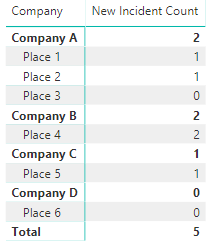
End result is:
– you get a total summary (at the bottom)
– you get your summary for Company A (and also for the other companies)
– all the blank values are now replaced with 0’sHope this helps.
Christian
——————————
Christian Eriksen
Director
Investment Controls Systems
——————————
——————————————- -

Don Mill
MemberJune 11, 2019 at 12:21 PM
Hi Christian,Thanks for responding. This almost get me there. However, when I change to a matrix 2 additional columns (which I didn’t mention earlier) now do not display correctly. These 2 columns are from a separate table. The columns in the matrix need to display exactly as they are in the table. However, the columns are only allowed to display as first, last, count, or count distinct. In a data table these same columns can be displayed as Don’t summarize, first, last, count distinct, and count. On the table I have selected don’t summarize and it displays exactly as needed, but the don’t summarize option is not available on the matrix. I tried change the type between text and whole number. That did give me different drop down options, but it still does not have don’t summarize. Ultimately, I just need to display the values that are associated with each company for these 2 additional columns. Any suggestion?
——————————
Don Mill
314-719-9585
——————————
——————————————- -

Ben Howard
MemberJune 11, 2019 at 2:50 AM
Hi,
Create a value in DAX that just adds a zero to the value, eg NewValue = Table[ColumnName] + 0, or if you are already using a DAX calc to create the value, just append +0 to the end. All those pesky <blanks> disappear!——————————
Ben Howard
MVP
——————————
——————————————- -

Christopher Schnaars
MemberJune 12, 2019 at 8:12 AM
I love this “trick.” Elegant and simple.——————————
Christopher Schnaars
LTI
——————————
——————————————- -

Nathan Peterson
MemberJune 11, 2019 at 8:04 AM
Try a measure like this:Incident Measure = SUM('YourTable'[Incident Count]) + 0??When blank is added with zero, it results in zero.
Regarding the sub-total and total not working:
– Does Incident Count come from a Fact table, or one of the 2 tables which contain Company and Place?
– I don’t think you’ll get the labels that you’re looking for, unless you specify the groupings. If you really need the specific labels, you could add the summarized rows to your fact table. It would then be a new Calculated Table. Use the SUMMARIZE function to get the totals and put them into a variable and then use UNION.——————————
Hope This Helps,
Nathan Peterson
npeterson@solidq.com
——————————
——————————————- -

Fernando Duran
MemberJune 11, 2019 at 9:43 AM
?I would also suggest checking your source data and making sure your data type for the column you want to count is set to ‘whole number’ prior to the measures and calculated columns.——————————
Fernando
Developer
——————————
——————————————- -

Nick Reyes
MemberJune 11, 2019 at 10:54 AM
?At the end of your calculation, inside the measure “Incident Count” add ‘+ 0’. Unlike NULLS in SQL a blank plus zero is zero.——————————
Nick Reyes
DBA II
Ontario CA
7144336295
——————————
——————————————-
DSC Communities replied 6 years, 2 months ago 1 Member · 0 Replies -
-
0 Replies
Sorry, there were no replies found.
The discussion ‘Table Visualization Not Showing Zeros’ is closed to new replies.


