Static Row Headers with calculated row values
-
Static Row Headers with calculated row values
Posted by DSC Communities on January 10, 2023 at 9:46 am-

Mike McLean
MemberJanuary 10, 2023 at 9:46 AM
Hello, newer user ro power bi desktop coming from Qlik Sense. In Qlik I was able to create a table with what I call static row headers and a row of calcualted fields. Here is what I am trying to accomplish, this is just a made up sample visual table.
Current Year Prior Year Year Over Year Change
Returns 50 40 10
Sales 125 105 20
Shipped 45 30 15
The first column Returns, Sales, and Shipped are static values that just describe the row of data. The other 3 columns are calculated values. Any help would greatly be appreciated.
——————————
Mike McLean
—————————— -

Jared Brown
MemberJanuary 11, 2023 at 8:19 AM
Hi Mike,
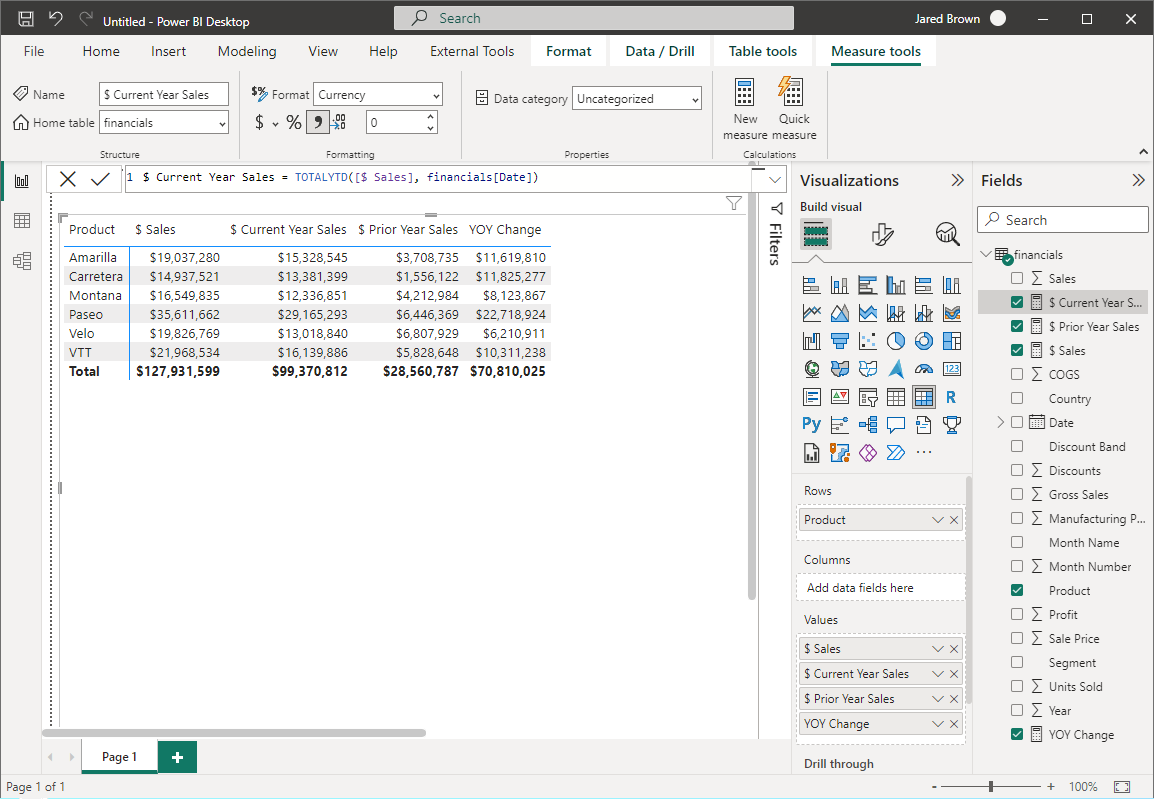
Instead of the Table visual, you should be able to use the Matrix visual, which is similar to an Excel PivotTable. Then rather than including specific Columns you can add multiple measures in the Values area. See the included picture. Note: While not shown in my example, you would want to use a Date dimension for your time-intelligence calculations.——————————
Jared Brown
Vice President, Data and Analytics
Tallan
Glastonbury CT
860-368-3079
——————————
——————————————- -

Sharavan Kumar
MemberJanuary 11, 2023 at 9:13 AM
The problem in matrix is repeated values in row is missing otherwise this matrix can be used several thingsRegardsKumar——————————————-
-

Adam Artur Boltryk
MemberJanuary 11, 2023 at 11:41 AM
Hi Mike,Hard to say if we can’t see INPUT, only desired output.
1. for me ‘Returns’, ‘Sales’ and ‘Shipped’ should be MEASURES.
2. all columns with time intelligence (including these not presented like – Current month, Current week, Last Monday, Previous quarter and all you can name) you can create as separate measures or use eg. Tabular editor.Regards,
——————————
Adam Artur Boltryk
Business Analyst
——————————
——————————————- -

Jared Brown
MemberJanuary 11, 2023 at 1:51 PM
Great point Adam, I hadn’t noticed that the rows were not categories, but a second set of measures. There are certainly several options to support two dynamic dimensions, and the use of Tabular Editor and Calculation Groups is probably the most elegant but does require the use of that third-party tool (definitely widely used and trusted).If you are trying to keep thing a little more simple (and I use that term loosely), one other option would be to create a separate table, commonly referred to as a disconnected slicer, to define the intersection of the separate concerns, the business measures (i.e. Sales, Revenue, …) and time-intelligence measures (Current Year, Prior Year, …). Power BI is starting to create wizards to support capabilities such as this, but it helps to understand what it is effectively doing behind the scenes.
What I have done here is a two step process, the first defines a table with the combinations of the two concerns you are looking to present, and the second associates a specific measure to use for each intersection.
Step 1:
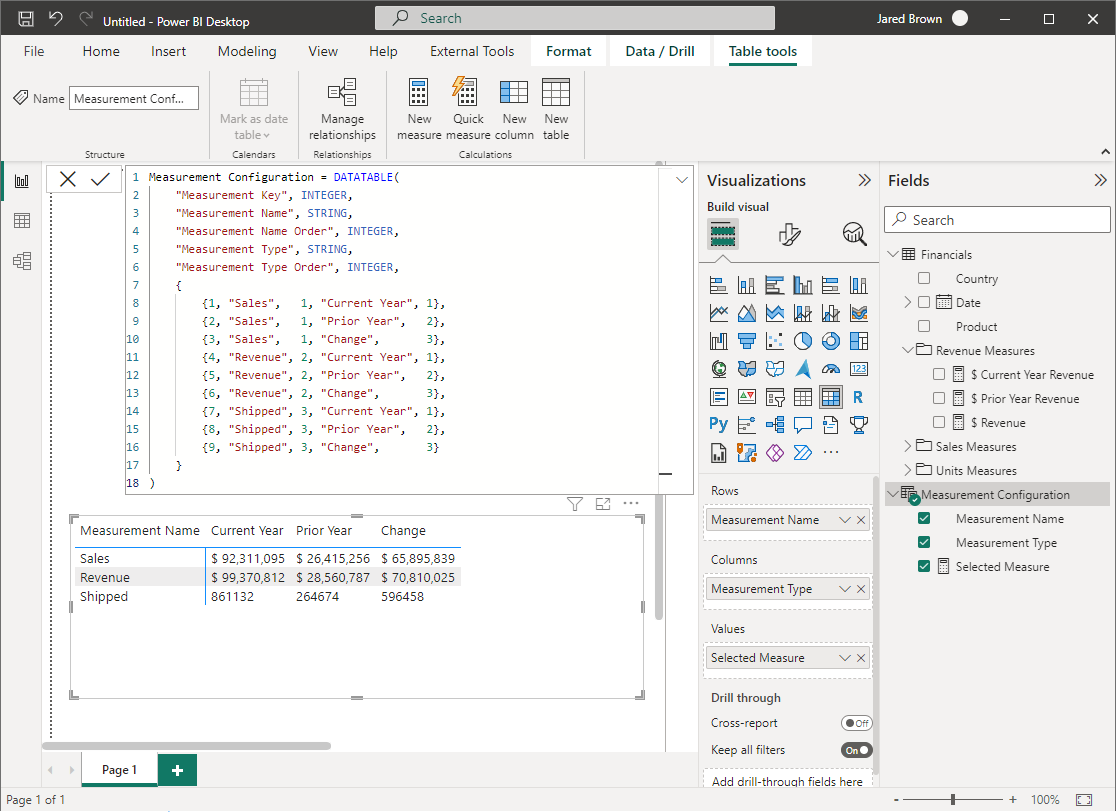
Use the “New Table” feature and shown DAX to create a separate configuration table, where each Key represents a unique intersection of the two dimensions. This could also be created in Power Query but this achieves the same result.Step 2:
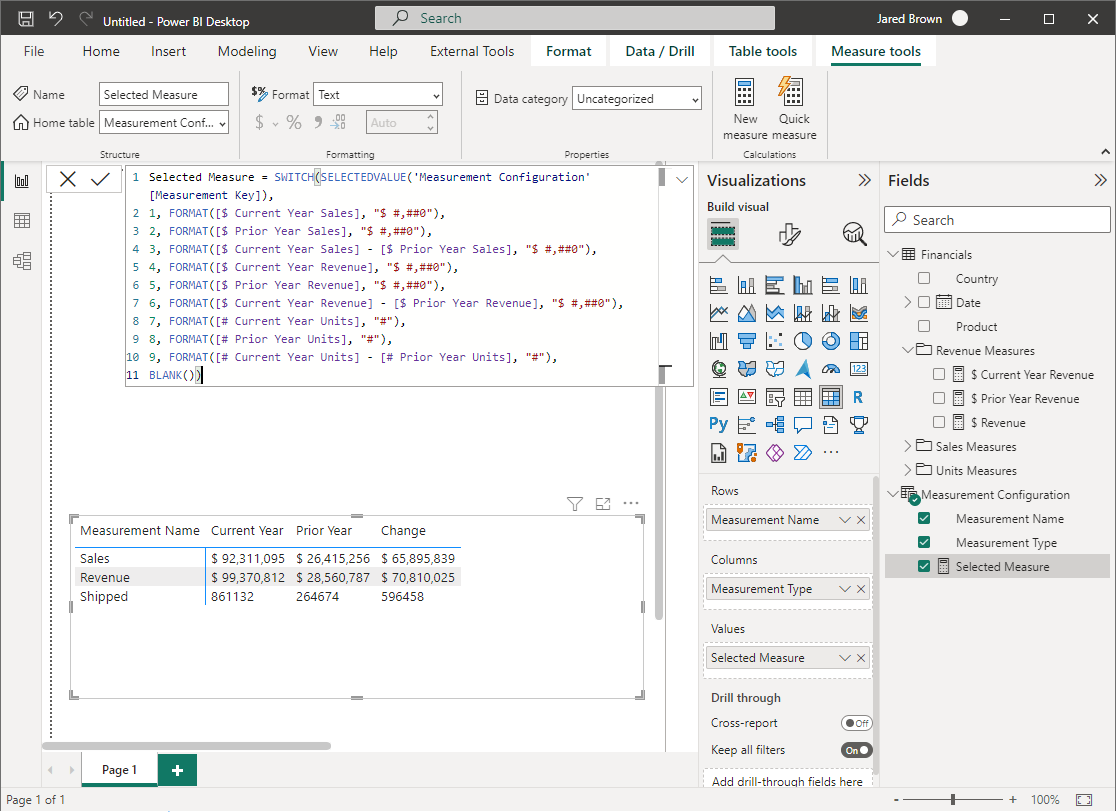
Add a DAX measure (called “Selected Measure” here) that depending on which combinations of the two separate dimension is selected, dictates which other measure or calculations to display (and how to format it).
Finally, you just need to add the two concerns as the Rows and Columns in the Matrix visual and the “Selected Measure” measure in the Values field.I have included the DAX below for reference:
Measurement Configuration = DATATABLE(
    "Measurement Key", INTEGER,
    "Measurement Name", STRING,
    "Measurement Name Order", INTEGER,
    "Measurement Type", STRING,
    "Measurement Type Order", INTEGER,
    {
        {1, "Sales",   1, "Current Year", 1},
        {2, "Sales",   1, "Prior Year",   2},
        {3, "Sales",   1, "Change",       3},
        {4, "Revenue", 2, "Current Year", 1},
        {5, "Revenue", 2, "Prior Year",   2},
        {6, "Revenue", 2, "Change",       3},
        {7, "Shipped", 3, "Current Year", 1},
        {8, "Shipped", 3, "Prior Year",   2},
        {9, "Shipped", 3, "Change",       3}
    }
)
Selected Measure = SWITCH(SELECTEDVALUE('Measurement Configuration'[Measurement Key]), 1, FORMAT([$ Current Year Sales], "$ #,##0"), 2, FORMAT([$ Prior Year Sales], "$ #,##0"), 3, FORMAT([$ Current Year Sales] - [$ Prior Year Sales], "$ #,##0"), 4, FORMAT([$ Current Year Revenue], "$ #,##0"), 5, FORMAT([$ Prior Year Revenue], "$ #,##0"), 6, FORMAT([$ Current Year Revenue] - [$ Prior Year Revenue], "$ #,##0"), 7, FORMAT([# Current Year Units], "#"), 8, FORMAT([# Prior Year Units], "#"), 9, FORMAT([# Current Year Units] - [# Prior Year Units], "#"), BLANK())——————————
Jared Brown
Vice President, Data and Analytics
Tallan
——————————
——————————————-
DSC Communities replied 2 years, 9 months ago 1 Member · 0 Replies -
-
0 Replies
Sorry, there were no replies found.
The discussion ‘Static Row Headers with calculated row values’ is closed to new replies.


