
Power Platform
Public Group
Active a day ago
Power Platform
Organizer:
- JOSE Organized by
-
-
Slicer Issue – Simplest Huge Problem I’ve had to date
-
Slicer Issue – Simplest Huge Problem I’ve had to date
Posted by DSC Communities on June 23, 2020 at 2:53 pm-

Jordan Mays
MemberJune 23, 2020 at 2:53 PM
Hi all,
I’ve been trying to solve an issue for about a month now that’s driving me crazy. �� I have a calculated column “YTD Flag” that I’m using to switch back and forth between YTD and Full Year views.
If you’re interested in how I did this, here’s my formulate for the calculated column:
YTD Flag = VAR maxdate=max(‘TKD'[year_period])
VAR maxmonth=right(maxdate,2)
return if(Dates[MonthOfYear]<=value(maxmonth),”Show YTD”,””)
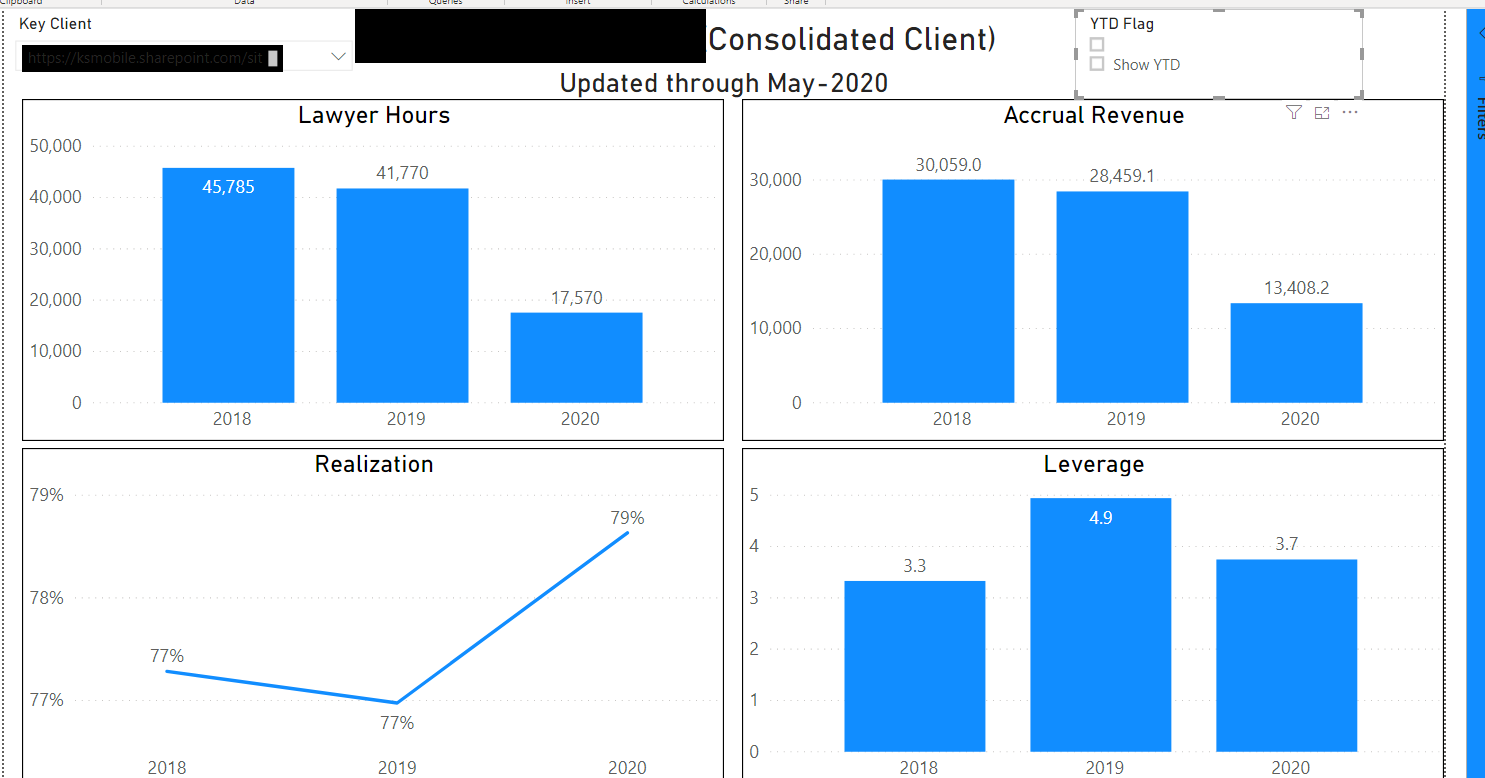
Below shows my slicer using the YTD flag calculated column.
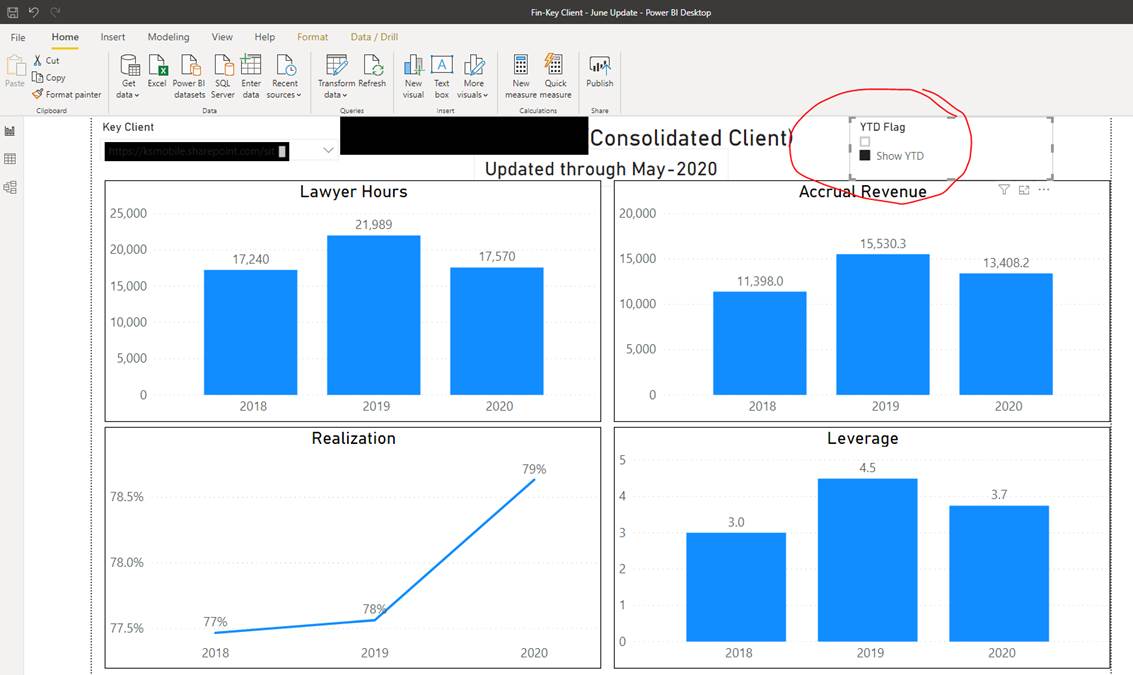
The slicer works great to show the YTD view. However, I really want a selection that shows Full Year. The blank, when selected, will show every month that’s not YTD, which is worthless. You can see full year views when you select both or clear the filter altogether, but I feel that may be to confusing for the end user. Does anyone know a way I could have a single select option to show full year or effectively clear the filter altogether, which would do the same thing? Bookmarks don’t seem to work as they capture whatever client is showing when it’s created. The user needs to be able to toggle back and forth between YTD and Full year views when viewing any client.
I hope this makes some sort of sense. I’ve been trying everything I can but have yet to find a solution. Thanks so much in advance for you help!
Best.
Jordan
King & Spalding Confidentiality Notice:
This message is being sent by or on behalf of a lawyer. It is intended exclusively for the individual or entity to which it is addressed. This communication may contain information that is proprietary, privileged or confidential or otherwise legally exempt from disclosure. If you are not the named addressee, you are not authorized to read, print, retain, copy or disseminate this message or any part of it. If you have received this message in error, please notify the sender immediately by e-mail and delete all copies of the message. Click here to view our Privacy Notice.
-
Aldwin Roes
MemberJune 24, 2020 at 3:55 AM
Hi Jordan,I think the best way to achieve this is to have dynamic measures in all your visuals. These dynamic measure would be controlled by a slicer at the top – but you want to create a separate table (no connections needed to any other tables in your model) with just 1 column “View” and two values “YTD” and “Year” (other descriptors are available). Then follow these two easy steps:
1. Replace your current slicer with a single-value select slicer for “View” – users will be able to select YTD or Year. Think about which you would like to be the default.
2. Within each visual you replace your measures (such as Lawyerhours) with something dynamic using a formula along the lines of:DynamicLawyerHours = SWITCH(
VALUES([View]),
“YTD”, Calculate(SUM([LawyerHours]),[YTDFlag]=”Show YTD”),
“Year”, Calculate(SUM([LawyerHours]),All[YTDFlag]),
BLANK()
)
You will see that this is based on you still having the YTD calculated column.
Hopefully that achieves what you want!
——————————
Aldwin Roes
Business Intelligence Analyst
——————————
——————————————- -
Trevor Cook
MemberJune 24, 2020 at 10:02 PM
Jordan:You could add a flag to the date dim for isCurrentYear and filter on that. In fact, I would create measures for all the time-frames (YTD, QTD, MTD and CurrYear, CurQTR, CurrMon) for completeness.
As for the YTD calculation you should look into the time intelligence functions. The are extraordinarily helpful. Here is one for YTD: https://docs.microsoft.com/en-us/dax/datesytd-function-dax.
What I would do is either:
- Create two tables in the model to manage the time frames. I have not used this but it would limit the total number of calculations required. I do not like the bi-directional filtering as there is a performance hit as a result and the many-to-many makes me nervous but the solution is still plausible.
- Create one table for the time-frames (YTD, QTD, MTD) and write the measures based on the values in the table when selected. I have used this method and it works well. Instead of separate calculations for YTD, QTD, MTD, I prefer to encapsulate all of the calculations into Switch statement. This reduces the number of formulas which is good but makes it so there are no individual calculations like Sales YTD to drop into a visualization. I do not see this as an issue as a visual level filter can be applied to resolve this.
Please let us know that your solution is. I always find it interesting to see how differently people approach a problem.
——————————
Trevor Cook
403-875-7438
——————————
——————————————-
DSC Communities replied 5 years, 4 months ago 1 Member · 0 Replies -
-
0 Replies
Sorry, there were no replies found.
The discussion ‘Slicer Issue – Simplest Huge Problem I’ve had to date’ is closed to new replies.
