
Power Platform
Public Group
Active 2 days ago
Power Platform
Organizer:
- JOSE Organized by
-
-
Slicer Help *file attached
-
Slicer Help *file attached
Posted by DSC Communities on October 20, 2022 at 11:03 am-

Beau A
MemberOctober 20, 2022 at 11:03 AM
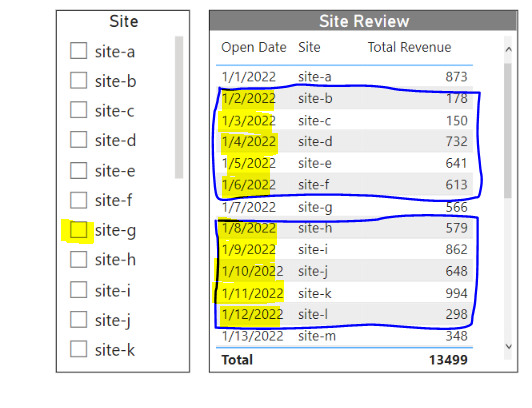
Problem Statement:
Is there a way to filter a dashboard by the 5 sites that opened before or after the selection in the Site slicer?
What possible ways could there be to do this? Another slicer would be ideal.
——————————
Beau A
Analyst
MI
—————————— -
Tomas Torp
MemberOctober 21, 2022 at 3:26 PM
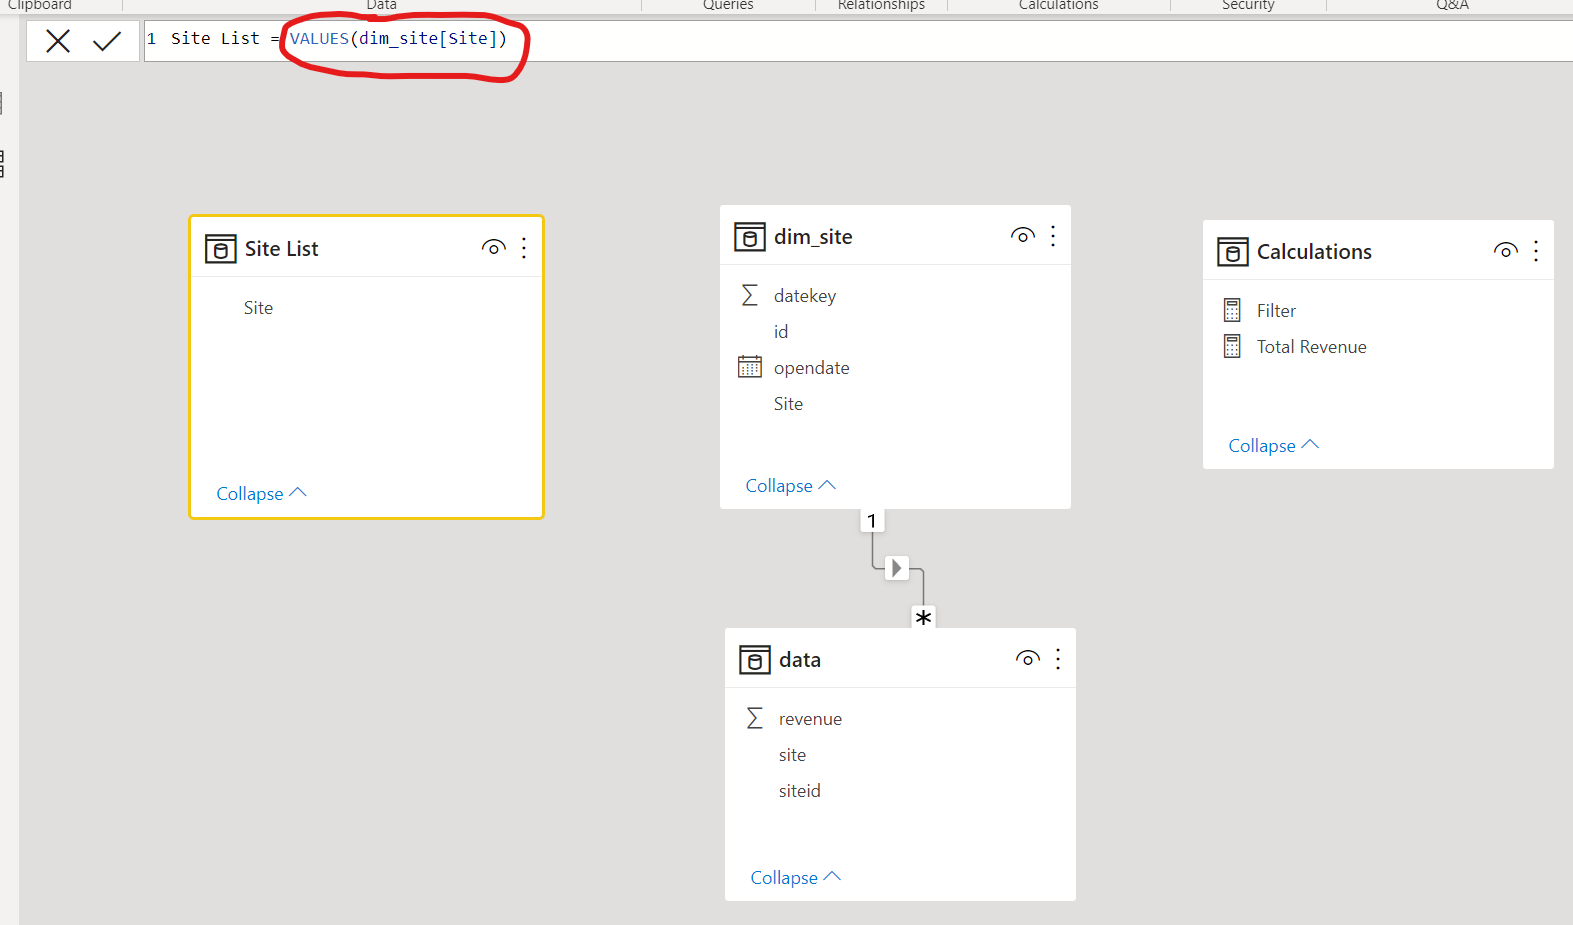
Here is my attempt at a solutionI added a new table with just a list of the sites without a connection to the rest of the model and used the column of this table in the slicer:
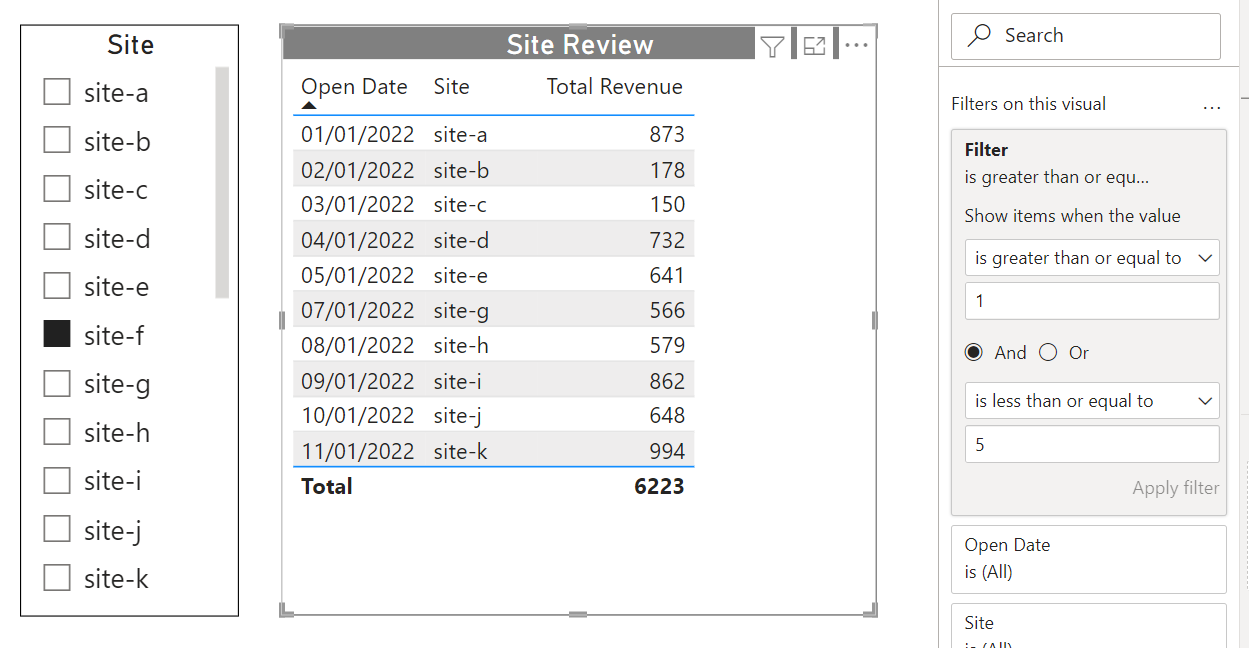
Then I created a measure that ranks the sites by opening date relative to the selected site in both directions. If a single site is not selected it just returns 1:Filter = VAR SelectedSite = SELECTEDVALUE ( 'Site List'[Site] ) VAR RankSelectedSite = CALCULATE ( RANKX ( ALL ( dim_site ), CALCULATE ( SELECTEDVALUE ( dim_site[opendate] ) ) ), REMOVEFILTERS ( dim_site ), TREATAS ( { SelectedSite }, dim_site[Site] ) ) VAR RankCurrentSite = RANKX ( ALL ( dim_site ), CALCULATE ( SELECTEDVALUE ( dim_site[opendate] ) ) ) VAR Result = IF ( ISBLANK ( SelectedSite ), 1, ABS ( RankCurrentSite - RankSelectedSite ) ) RETURN Result?Finally, I used the measure as a filter on the table visual with the condition that the value should be between 1 and 5. Since the selected site will have rank 0, it will not be included. Of course, in case of ties you might get more than five sites on either side of the selected site with this method:
——————————
Tomas
——————————
——————————————- -
Vilmar Santos
MemberOctober 25, 2022 at 9:32 PM
Outra opção em anexo——————————
Vilmar Santos
——————————
——————————————- -
Kaz Shakir
MemberOctober 31, 2022 at 8:40 PM
,
I think that the solution that came up with is much nicer, but I wanted to give you another alternative. This one is a little bit more brute force.
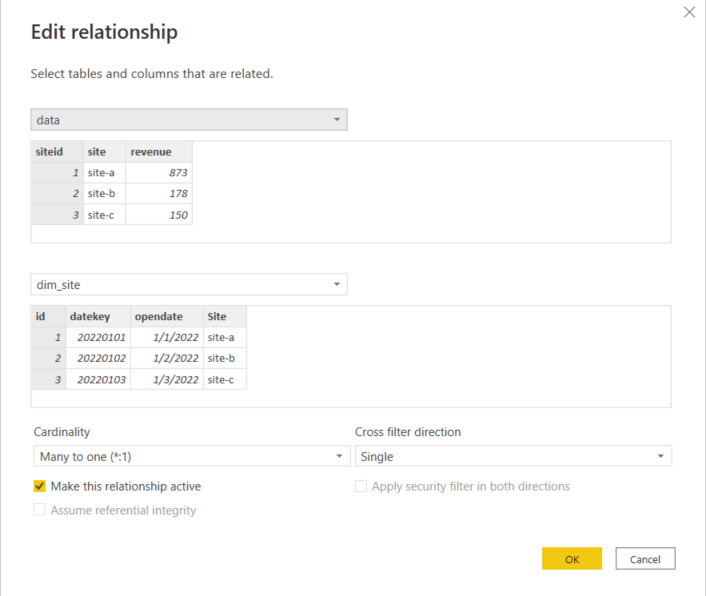
I took your dataset, and I deleted the relationship between the dim_site table and the data table. Then I created a calculated column in the data table that essentially gets the related date from dim_site, like so:
Open Date =
VAR thisSite = data[siteid]
VAR filteredSites = FILTER(dim_site, dim_site[id] = thisSite)
RETURN
    MAXX(filteredSites, dim_site[opendate])
Next, in the dim_site table I created 10 calculated columns. 5 columns for the 5 sites with an open date before the current site, and 5 columns for the 5 sites with an open date after the current site. Here is the formula for one of those columns, as an example:
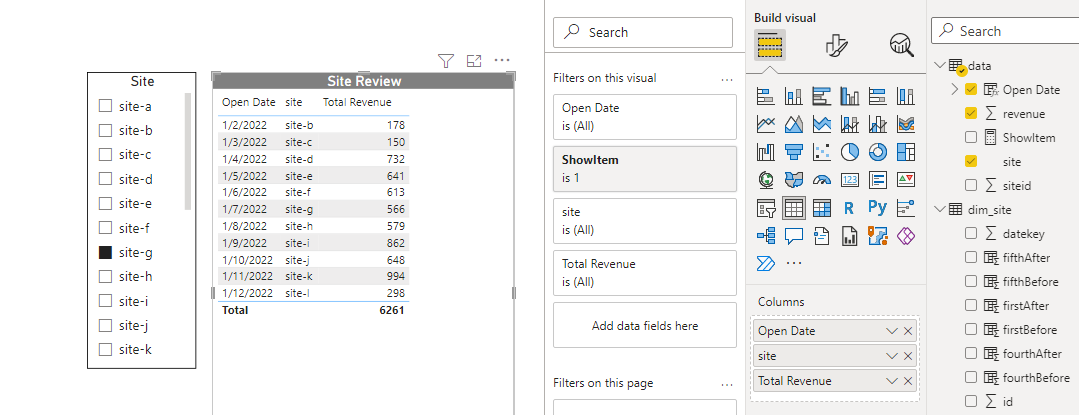
thirdBefore =
VAR thisSite = dim_site[id]
VAR thisDate = dim_site[opendate]
VAR firstBefore = dim_site[firstBefore]
VAR secondBefore = dim_site[secondBefore]
VAR filteredData =
    FILTER(
        dim_site,
        dim_site[id] <> thisSite && dim_site[opendate] <= thisDate && dim_site[id] <> firstBefore && dim_site[id] <> secondBefore
    )
VAR result =
MAXX(
    TOPN(
        1,
        ADDCOLUMNS(
            filteredData,
            "DimSiteId", dim_site[id],
            "@Days Before",
            SWITCH(
                TRUE(),
                thisDate > dim_site[opendate], DATEDIFF(dim_site[opendate], thisDate, DAY),
                DATEDIFF(thisDate, dim_site[opendate], DAY)
            )
        ),
        [@Days Before],
        ASC
    ),
    dim_site[id]
)
RETURN
    result
Last, I created a measure called “ShowItem” that will result in true if a given row in the data table should be shown in our table visual. The formula for this measure looks like this:
ShowItem =
    IF(
        MAX(data[siteid]) = MAX(dim_site[id]) ||
        MAX(data[siteid]) = MAX(dim_site[firstBefore]) || MAX(data[siteid]) = MAX(dim_site[firstAfter]) ||
        MAX(data[siteid]) = MAX(dim_site[secondBefore]) || MAX(data[siteid]) = MAX(dim_site[secondAfter]) ||
        MAX(data[siteid]) = MAX(dim_site[thirdBefore]) || MAX(data[siteid]) = MAX(dim_site[thirdAfter]) ||
        MAX(data[siteid]) = MAX(dim_site[fourthBefore]) || MAX(data[siteid]) = MAX(dim_site[fourthAfter]) ||
        MAX(data[siteid]) = MAX(dim_site[fifthBefore]) || MAX(data[siteid]) = MAX(dim_site[fifthAfter])
        , 1, 0)
And I changed the “Site Review” table visual so that it only uses columns from the data table, and result looks like this:
The file with this approach is attached here as well.
I hope you find this helpful.
Kaz.?
?
——————————
Kaz Shakir
Sr. Program Manager, Asset Planning
TN
——————————
——————————————-
DSC Communities replied 3 years, 5 months ago 1 Member · 0 Replies -
-
0 Replies
Sorry, there were no replies found.
The discussion ‘Slicer Help *file attached’ is closed to new replies.
