
Power Platform
Public Group
Active 2 days ago
Power Platform
Organizer:
- JOSE Organized by
-
-
Show value from selected date range
-
Show value from selected date range
Posted by DSC Communities on November 1, 2022 at 7:10 am-

Helen Wrensted
MemberNovember 1, 2022 at 7:10 AM
Hi.I am trying to create a report showing the development in purchase prices over a given period. In inclosed report, I have the purchase prices in one table and a date table.
When I select a period (based on date table) from March 12 2021 to March 30 2022 I would like to see all puchase prices in this period. However, if I have a purchase price valid from January 1 2021 to April 30 2021 this price wont show in the report as the start date for the price is before the start date in the date table.How can I solve this? The price is valid on March 12…
Pls. see enclosed file – I have used article “Test 4” in above description.
Thanks a lot in advance.
Helen——————————
Helen Wrensted
Business Developer
—————————— -
Rd 3nidad
MemberNovember 2, 2022 at 4:55 AM
Hi Helen,
Here’s what you should do:
a. Create another date table and connect to valid from column —> this is just have your date always at the beginning of the month (you can use valid from date directly as well)
b. Create inactive relationship between main table and existing date table (connection: Valid to and Date)
c. Create a formula to incorporate the “valid to” values to your existing results (I removed the unnecessary formula btw).PricePerStartOfMonth =Var MaxDate = CALCULATE(MAX(‘Date'[Date]),ALLSELECTED(‘Date'[Date]))Var MinDate = CALCULATE(Min(‘Date'[Date]),ALLSELECTED(‘Date'[Date]))VAR ValidTo = CALCULATE (MAX ( ‘Historic_Gross_Price'[Price] ),USERELATIONSHIP(Historic_Gross_Price[Valid to],’Date'[Date]),MinDate>=Historic_Gross_Price[Valid from] && MinDate <=Historic_Gross_Price[Valid to])RETURNCALCULATE(MAX ( ‘Historic_Gross_Price'[Price] ),’Date'[First day] = “Yes”) +ValidTo——————————
Rd 3nidad
Senior Finance Analyst
——————————
——————————————- -
Helen Wrensted
MemberNovember 2, 2022 at 12:50 PM
Hi.Thanks a lot for your reply.
It works great! However, I have a problem with the prices that are effective from dates that are not the first day of the month. In enclosed file, I have added a simple matrix where we would like to see all cost prices in selected period. For article Test 4 it is fine, but if you look at article Test 3 (where some of the prices are effective from mid month), prices are missing.
How can this be soved?
Thanks a lot in advance.——————————
Helen Wrensted
Business Developer
——————————
——————————————- -
Rd 3nidad
MemberNovember 2, 2022 at 3:25 PM
Hi Helen, In that case, just remove the filter context in the formula.PricePerStartOfMonth =Var MaxDate = CALCULATE(MAX(‘Date'[Date]),ALLSELECTED(‘Date'[Date]))Var MinDate = CALCULATE(Min(‘Date'[Date]),ALLSELECTED(‘Date'[Date]))VAR ValidTo = CALCULATE (MAX ( ‘Historic_Gross_Price'[Price] ),USERELATIONSHIP(Historic_Gross_Price[Valid to],’Date'[Date]),MinDate>=Historic_Gross_Price[Valid from] && MinDate <=Historic_Gross_Price[Valid to])RETURNCALCULATE(MAX ( ‘Historic_Gross_Price'[Price] )) +ValidTo——————————
Rd 3nidad
Senior Finance Analyst
——————————
——————————————- -
Helen Wrensted
MemberNovember 6, 2022 at 7:38 AM
It works perfectly – thanks a lot!——————————
Helen Wrensted
Business Developer
——————————
——————————————- -
Tomas Torp
MemberNovember 4, 2022 at 7:25 PM
From the title of the measure, “Price per start of month”, I assume that you want the price to be displayed not on the actual valid from date, but at the first month start date on or after the valid from date. In the attached file I have set up a solution based on that assumption.——————————
Tomas
——————————
——————————————- -
Helen Wrensted
MemberNovember 6, 2022 at 8:44 AM
Hi Tomas.Thanks a lot for the solution, which works great for the first month start date.
——————————
Helen Wrensted
Business Developer
——————————
——————————————- -
Kaz Shakir
MemberNovember 5, 2022 at 4:51 PM
,
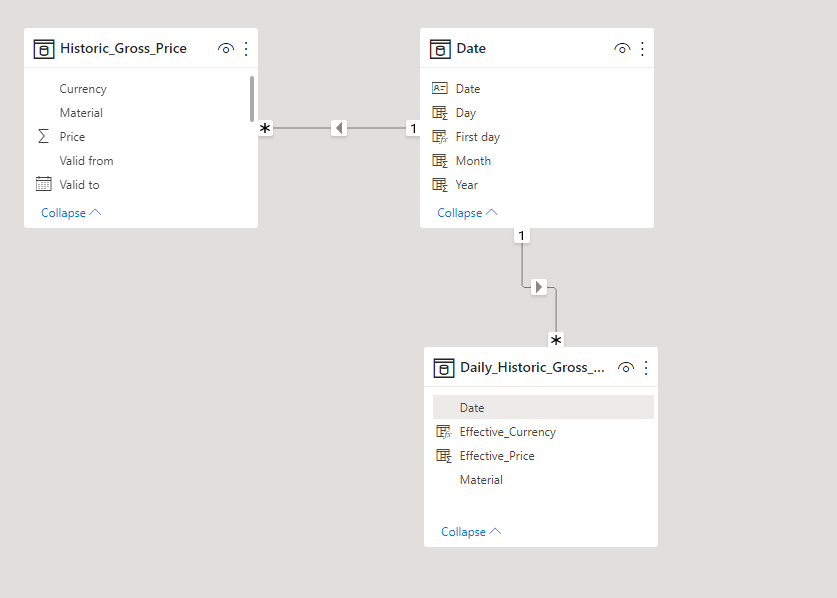
I think that you should get the result that you want if you simply delete the relationship between your Date table and the Historic_Gross_Price table. Then the measures you have created will give you the results that you are expecting. So, your data model will simply look like this: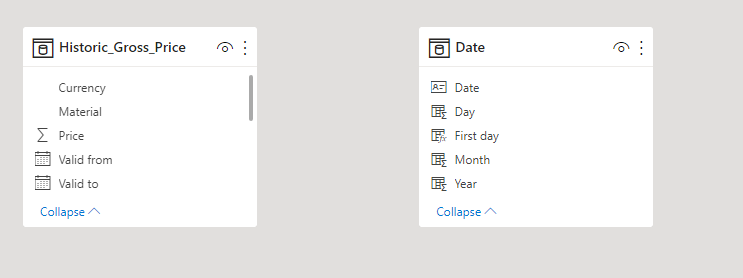
And after you delete that relationship, your resulting matrix will look like this: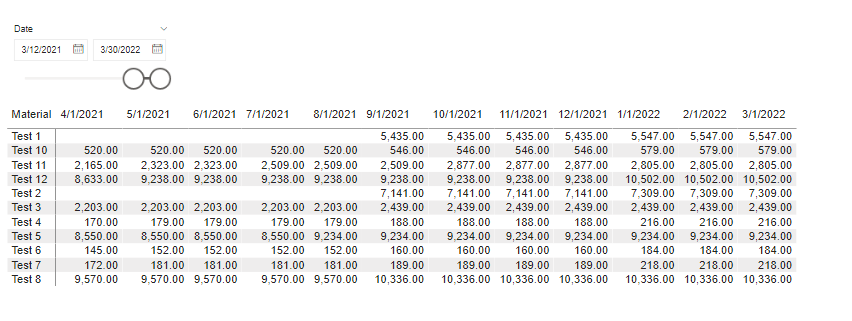 Another approach would be to create a new historic gross price table, where the prices for each “Material” are shown for each date. This new table will be a cross join between that dates of the date table and different material. Here is the formula I used to create that table:
Daily_Historic_Gross_Price =
CROSSJOIN(
    Calendar( Date(2017, 1, 1), Date(2022,3,30)),
    VALUES(Historic_Gross_Price[Material])
)?
?Next, I would create calculated columns in this new Daily_Historic_Gross_Price table that show the price that’s effective on that given date for that given material, and another to show the currency that is effective during that time as well. Here are the formulas for those columns:
Effective_Price =
VAR currentDate = 'Daily_Historic_Gross_Price'[Date]
VAR currentMaterial = 'Daily_Historic_Gross_Price'[Material]
VAR filteredData =
    FILTER(
        Historic_Gross_Price,
        Historic_Gross_Price[Material] = currentMaterial && Historic_Gross_Price[Valid from] <= currentDate && Historic_Gross_Price[Valid to] >= currentDate
    )
VAR relatedPrice =
    MAXX(
        filteredData,
        Historic_Gross_Price[Price]
    )
RETURN
    relatedPrice?
Effective_Currency = VAR currentDate = 'Daily_Historic_Gross_Price'[Date] VAR currentMaterial = 'Daily_Historic_Gross_Price'[Material] VAR filteredData = FILTER( Historic_Gross_Price, Historic_Gross_Price[Material] = currentMaterial && Historic_Gross_Price[Valid from] <= currentDate && Historic_Gross_Price[Valid to] >= currentDate ) VAR relatedCurrency = MAXX( filteredData, Historic_Gross_Price[Currency] ) RETURN relatedCurrencyThen, in your data model, you would connect the Date table to this new Daily_Historic_Gross_Price table:
 Finally, in your table visualization, you would use the columns from the Date table and the Daily_Historic_Gross_Price table, so the result would look like this:
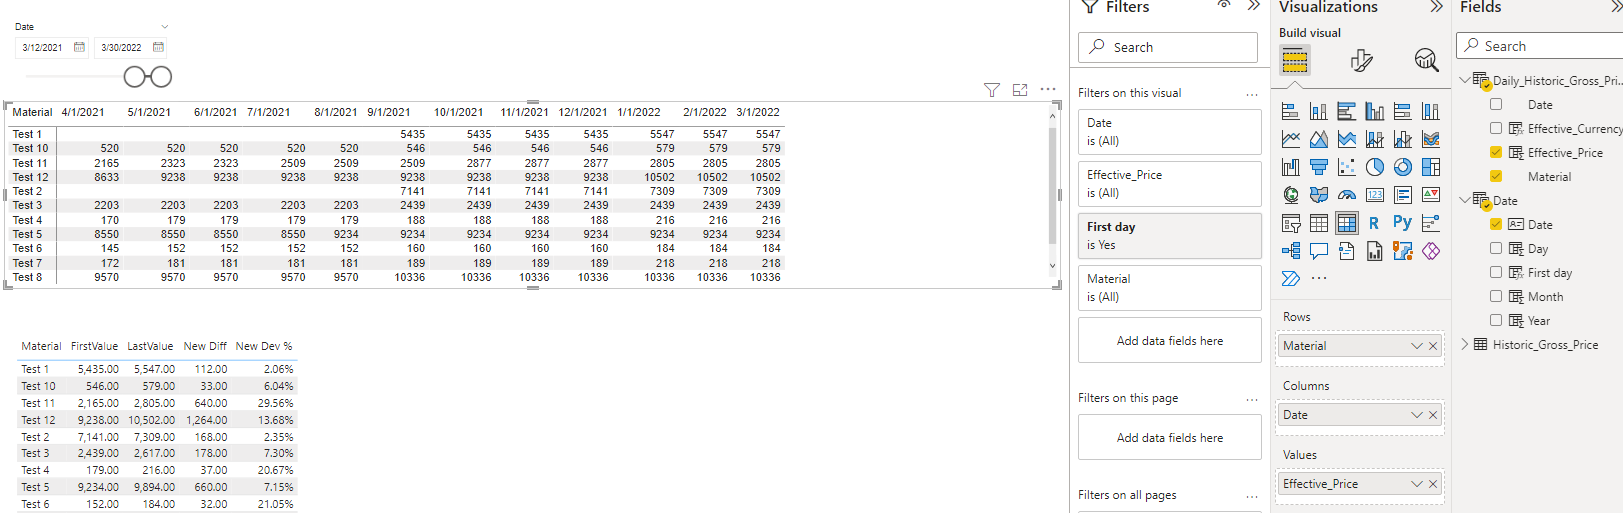
I am attaching my solution here for your review.
Please let us know if this gets you the results you were looking for.Kaz.
——————————
Kaz Shakir
Sr. Program Manager, Asset Planning
TN
——————————
——————————————- -
Helen Wrensted
MemberNovember 6, 2022 at 8:39 AM
Hi Kaz.Thanks a lot for your solution – it works great!
——————————
Helen Wrensted
Business Developer
——————————
——————————————-
DSC Communities replied 3 years, 5 months ago 1 Member · 0 Replies -
-
0 Replies
Sorry, there were no replies found.
The discussion ‘Show value from selected date range’ is closed to new replies.
