
Power Platform
Public Group
Active 2 days ago
Power Platform
Organizer:
- JOSE Organized by
-
-
[ Show Data In Table Chart ]
-
[ Show Data In Table Chart ]
Posted by DSC Communities on May 13, 2019 at 5:40 am-

Pham Trinh
MemberMay 13, 2019 at 5:40 AM
Hi,
I have a poblem.
When I choose the Number of Transaction, only the change in the 1st chart, but there was no change in the 2nd chart according to the 1st chart.
Due to PowerBI don’t support filter in measure. But “NumberOfTransaction” is measure, so I read
https://www.pbiusergroup.com/communities/community-home/digestviewer/viewthread?MessageKey=c78f7a0c-5fa4-40c9-896a-d161eaa9449e&CommunityKey=b35c8468-2fd8-4e1a-8429-322c39fe7110&tab=digestviewer#bmc78f7a0c-5fa4-40c9-896a-d161eaa9449e%C2%A0
And I created filter measure. But When I choose the Number of Transaction, only the change in the 1st chart, but there was no change in the 2nd chart according to the 1st chart.
Expect Result when I Choose NumberOfTransaction = 1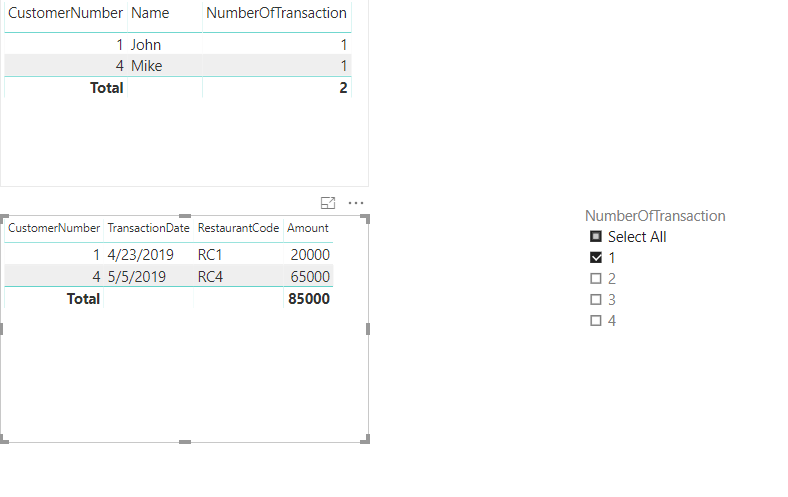 Expect Result when I choose NumberOfTransaction = 4
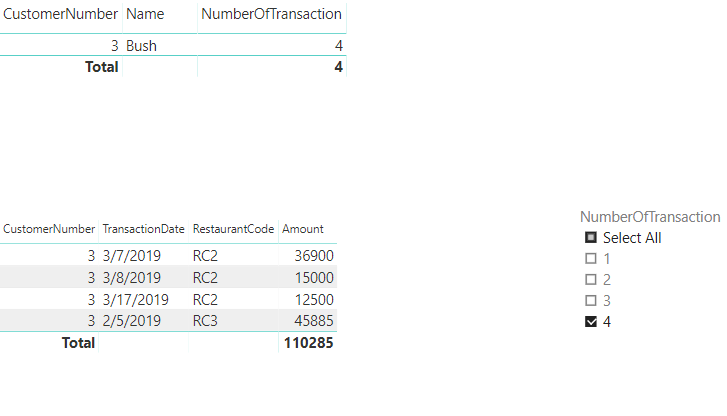
(( file power bi attach ))
——————————
Pham Trinh
979319896
—————————— -
Aurelien BETBEUI KWANDJEU
MemberMay 13, 2019 at 8:47 AM
Hello Pham,If you have seen what you have done, you should also add the “Sales Filter” indicator in the “Element Level Filters” session of your second table.
This one is present for table 1.Once you have added the filter it will be necessary to rework the formula of the indicator “Sales Filter”.
Regards,
——————————
Aurelien BETBEUI KWANDJEU
CHIEF DATA OFFICER (BI & DWH)
0033766857584
——————————
——————————————- -
Pham Trinh
MemberMay 13, 2019 at 10:08 PM
Hi Aurelien ,
I’m a Power BI beginner, can you help me with the keyword to solve this problem?
Thank you very much !——————————
Pham Trinh
979319896
——————————
——————————————- -
Hasham Niaz
MemberMay 15, 2019 at 1:39 AM
Hi Pham,It is easier to solve the problem through Data Modelling rather than DAX, i have done following to solve it;
1) Create a Summarize table [TransactionSummary] with 2 columns [CustomerNumber], [NoOfTransaction], use below DAX;
TransactionSummary = SUMMARIZE(TransactionInformation
      , CustomerInformation[CustomerNumber], "NoOfTransaction", COUNT(TransactionInformation[CustomerNumber])
      ) ?
2) Create another table using Data entry option & provide [NoOfTrans] from [0-10] this could be dynamic as well;
3) Create following relationships;[CustomerInfomation] -> [TransactionSummary] (1 to 1) based on [CustomerNumber], set cross filter direction to [Both]
[CustomerInfomation] -> [TransactionInformation] (1 to Many) based on [CustomerNumber], set cross filter direction to [Single]
[NoOfTrans] -> [TransactionSummary] (1 to Many) based on [NoOfTransaction], set cross filter direction to [Single]4) Now place a slicer filter from [NoOfTrans] table & it will do the magic of filtering both of your visuals.
Attached is the .pbix file for your reference.
Regards,
——————————
Hasham Bin Niaz
Sr. BI Consultant
Karachi, Pakistan
——————————
——————————————- -
Pham Trinh
MemberMay 15, 2019 at 2:46 AM
No , I create NumberOfTransaction with “measure” , not “column”. Because If I created slicer filter Restaurant , so it is fail with “column”.
So I want solotion with “measure”
Thanks Hasham——————————
Pham Trinh
979319896
——————————
——————————————- -
Hasham Niaz
MemberMay 16, 2019 at 12:09 AM
Please describe your requirements more clearly;You need to filter based on [Restaurant Code] as well meaning when you pick any [Restaurant Code] & chose [NoOfTransaction] so it will need to filter based on both right.
Suppose [Customer2] has 4 transactions in all, 1 transaction at each restaurant, so when you choose [Rest2] and [NoOfTransaction] = 2, then [Customer2] should not be shown.
Regards,
——————————
Hasham Bin Niaz
Director Data & Analytics
Karachi, Pakistan
——————————
——————————————-
DSC Communities replied 6 years, 3 months ago 1 Member · 0 Replies -
-
0 Replies
Sorry, there were no replies found.
The discussion ‘[ Show Data In Table Chart ]’ is closed to new replies.
