
Power Platform
Public Group
Active a day ago
Power Platform
Organizer:
- JOSE Organized by
-
-
NEW COLUMN using SWITCH & AND
-
NEW COLUMN using SWITCH & AND
Posted by DSC Communities on July 13, 2020 at 2:57 am-

Pramitha Kannimbele
MemberJuly 13, 2020 at 2:57 AM
Hi all,
I want to categorize my data into 4 categories: INSPIRED, MOTIVATED, DISENCHANTED AND DETACHED in one column. I am not able to make it.
Can someone help me with how to go about it?Thanks and Regards
——————————
Pramitha Kannimbele
DEVELOPER
—————————— -
Brian Connelly
MemberJuly 14, 2020 at 12:50 AM
Can you elaborate? I reviewed the PBIX example, but have no idea what your asking.——————————
Brian Connelly
Manager Business Analytics and Insights
Ashfield Healthcare
——————————
——————————————- -
Pramitha Kannimbele
MemberJuly 14, 2020 at 1:05 AM
Hello Mr Connelly,
Thanks for replying.
By today I have advanced a bit towards it. Please check out the IMDD table. I have made a column out of 4 measures: INSPIRED COUNT, MOTIVATED COUNT, DISENCHANTED COUNT and DETACHED COUNT.
But the problem again is that the IMDD Column is not showing DISENCHANTED.?What could be the possible fix for this?
Thanks in advance.
——————————
Pramitha Kannimbele
DEVELOPER
——————————
——————————————- -
Brian Connelly
MemberJuly 14, 2020 at 1:33 AM
, You are going to continue to hav problems. After I starting looking into your issue, you have a model design issue. You have an Input and an Output core table, then everything else is summarized. I noticed that you deleted relationships in this model as well. What is your end goal?——————————
Brian Connelly
Manager Business Analytics and Insights
Ashfield Healthcare
——————————
——————————————- -
Brian Connelly
MemberJuly 14, 2020 at 1:42 AM
As i looked at your tables, why not create the measures for example:This table:
Disenchanted JR table =
SUMMARIZECOLUMNS(
    'OUTPUT'[Respondent ID],'OUTPUT'[Email Address],
    FILTER('INPUT','INPUT'[Level]="JR"),
    FILTER('OUTPUT','OUTPUT'[Questions] IN {"Q1", "Q11", "Q5", "Q7", "Q8"}),
    FILTER('OUTPUT','OUTPUT'[Ratings] < 4),
    "Question Count", COUNT('OUTPUT'[Questions])
)?
became this measure:
Disenchanted JR Question Count = SUMX(
SUMMARIZECOLUMNS(
    'OUTPUT'[Respondent ID],'OUTPUT'[Email Address],
    FILTER('INPUT','INPUT'[Level]="JR"),
    FILTER('OUTPUT','OUTPUT'[Questions] IN {"Q1", "Q11", "Q5", "Q7", "Q8"}),
    FILTER('OUTPUT','OUTPUT'[Ratings] < 4),
    "Question Count", COUNT('OUTPUT'[Questions])),[Question Count]
)?
——————————
Brian Connelly
Manager Business Analytics and Insights
Ashfield Healthcare
——————————
——————————————- -
Pramitha Kannimbele
MemberJuly 14, 2020 at 5:59 AM
Sir,
I have the correct measures for all the requirements. But if you check the first sheet in the dashboard, you’d see an Aster Plot visualization, which needs columns to interpret data. And Aster Plot is an important aspect of my dashboard. Otherwise, the dashboard is set to go.
The only problem is with the IMDD Column, which is showing all Categories but one – Disenchanted. And I need help with it. Do you, sir, think it’s possible?
Thanks.
——————————
Pramitha Kannimbele
DEVELOPER
——————————
——————————————- -
Gopa Kumar Sivadasan
MemberJuly 14, 2020 at 12:05 PM
HiIf I understand you correctly (based on your initial posting):
- You want to categorize your data into 4 categories (Inspired, Motivated, Disenchanted, and Detached). I assume you want to use this as slicers and / or as category field in your visuals. Hence, you need this as a column in your table.
- The above classification is based on specific conditions derived from values in other columns.
If the above understanding is correct:
- can you please clearly specify the conditions for deriving each of the 4 categories?
- You need this categorization at email ID level?
?
——————————
Gopa Kumar
Limner ConsultingNorth Kerala User Group Leader
https://www.pbiusergroup.com/NorthKerala
——————————
——————————————- -
Pramitha Kannimbele
MemberJuly 15, 2020 at 12:23 AM
Yes, sir, You are correct. The conditions for deriving each condition is:
There are 3 levels of employees, Junior, Middle and Senior.
There are 15 questions
And there are 3 types of questions. Very Important, Important and Not important.1. INSPIRED: All questions need to be rated 4 or 5 by an employee, then count the number of employees.
2. MOTIVATED: Only “Very Important” Questions need to be rated 4 or 5, then count the number of employees.
3. DISENCHANTED:
Junior: Out of the 5 Very Important questions, any 1 question should be rated less than 4.
Middle: Out of the 6 Very Important questions, any 3 questions should be rated less than 4.
Senior: Out of the 9 Very Important questions, any 4 questions should be rated less than 4.
4. DETACHED: All the rest.——————————
Pramitha Kannimbele
DEVELOPER
——————————
——————————————- -
Gopa Kumar Sivadasan
MemberJuly 15, 2020 at 5:50 AM
HiWhat is the criteria to classify the Questions as ‘Very Important’, ‘Important’, and ‘Not Important’ ? ?
——————————
Gopa Kumar
Limner ConsultingNorth Kerala User Group Leader
https://www.pbiusergroup.com/NorthKerala
——————————
——————————————- -
Pramitha Kannimbele
MemberJuly 15, 2020 at 6:15 AM
Sir, those are predefined categories given for me to work on, but measures include only Very Important Questions?.——————————
Pramitha Kannimbele
DEVELOPER
——————————
——————————————- -
Gopa Kumar Sivadasan
MemberJuly 15, 2020 at 6:46 AM
Hi
I am not sure whether i understand you fully.- Your derivation of the category depends on the type of question also. Hence, without knowing how to classify the 15 questions into ‘Very Important’ etc, I do not know how to arrive at the derivation logic;
- From your point no 3 above (DISENCHANTED), I assume the question classification into ‘Very Important’ etc also depends on the level of the employee (Junior: Out of the 5 Very Important questions, any 1 question should be rated less than 4., Middle: Out of the 6 Very Important questions, any 3 questions should be rated less than 4……..)
- I have not understood ‘ ….but measures include only Very Important Questions?’. what does this mean? Are you saying the classification criteria contains only ‘Very Important question’? That may be so, but how can we know which are the important questions out of the 15 questions?
I am sorry I have not been of much help.
——————————
Gopa Kumar
Limner ConsultingNorth Kerala User Group Leader
https://www.pbiusergroup.com/NorthKerala
——————————
——————————————- -
Pramitha Kannimbele
MemberJuly 15, 2020 at 7:08 AM
I can explain, sir.1. The classification of the 15 questions is predefined. It is given in the Excel sheet I’ve attached in my previous messages. So we KNOW what category a question is, we don’t have to derive it. The file is called Worksheet(Pramita), you can find it in my previous messages. I have also attached the pbix file I’m working on.
2. Your assumption is correct, sir. The Question classification into ‘Very Important’ also depends on the employee level. Again, it is given in the worksheet.
3. Yes, to answer your 3rd point, to classify the criteria, it is enough to know the Very Important Questions, which, again, is mentioned in the file. I think I’ll just attach it again for easier reference.I am grateful for your quick and insightful replies, thanks again, Sir.
——————————
Pramitha Kannimbele
DEVELOPER
——————————
——————————————- -
Gopa Kumar Sivadasan
MemberJuly 15, 2020 at 12:15 PM
HiPlease see if the following helps you:

?
I have made the category as a calculated column in the ‘Input’ table, as this table seems to be like a master table. I have made slight changes to the model.
- Has changed the relationship between the ‘Input’ and ‘Output’ tables as 1: many with single cross-filter direction.

2. Has created a table for the question using ‘Enter Data’.
the above was transformed to:

3. DAX for the calculated column.Category = --------------------------------------------------- VAR _emailID = Input[Email Address] --current row context VAR _level = Input[Level] -- current row context VAR __ImportantQuestions = CALCULATETABLE( VALUES( Questions[Qno] ), Questions[Level] = _level, Questions[IS Important] = TRUE() ) --temp table to hold the important questions relevant to the current level VAR _impQCount = COUNTROWS( __ImportantQuestions ) --the count of important questions for the current level in context VAR _outputCount = CALCULATE( COUNTROWS( Output ), Output[Email Address] = _emailID ) --total number of rows in the output table for the email in row context. This is to check if the person has answered the questions. ------------------------------------------------ --INSPIRED Check --INSPIRED: All questions need to be rated 4 or 5 by an employee VAR _InspiredCheck = CALCULATE( COUNTROWS( Output ), Output[Ratings] IN { 4, 5 } ) ------------------------------------------------ --MOTIVATED check --MOTIVATED: Only "Very Important" Questions need to be rated 4 or 5 VAR _motivatedCheck = CALCULATE( COUNTROWS( Output ), Output[Ratings] IN { 4, 5 }, Output[Questions] IN __ImportantQuestions ) ------------------------------------------------ --DISENCHANTED check /*DISENCHANTED: Junior: Out of the 5 Very Important questions, any 1 question should be rated less than 4. Middle: Out of the 6 Very Important questions, any 3 questions should be rated less than 4. Senior: Out of the 9 Very Important questions, any 4 questions should be rated less than 4 */ VAR _lessthan4Count = CALCULATE( COUNTROWS( Output ), Output[Ratings] < 4, Output[Questions] IN __ImportantQuestions ) VAR _disenchantedCheck = SWITCH( TRUE(), _level = "JR", IF( _lessthan4Count = 1, TRUE, FALSE() ), _level = "MID", IF( _lessthan4Count = 3, TRUE(), FALSE() ), _level = "SR", IF( _lessthan4Count = 4, TRUE(), FALSE() ), FALSE() ) ------------------------------------------------- RETURN /* Logic: Inspired = the count of rating 4,5 should be equal to the number of questions which is 15 Motivated = all important questions should have rating 4 or 5 Disenchanted: the output from the variable disenchanted check should be true Blank: if there are employees in Input who has not yet answered the questions, then their classification is taken as blank detached: employees not falling in any of the above 4 categories */ SWITCH( TRUE(), _InspiredCheck = 15, "INSPIRED", _motivatedCheck = _impQCount, "MOTIVATED", _disenchantedCheck = TRUE(), "DISENCHANTED", _outputCount = BLANK(), BLANK(), "DETACHED" ) ?I am not sure as to how this will work with your other reporting requirements. Hope at least that it gives an idea of the solution.
Has also attached the pbix and the excel data files I used for your reference.
——————————
Gopa Kumar
Limner ConsultingNorth Kerala User Group Leader
https://www.pbiusergroup.com/NorthKerala
——————————
——————————————- -
Pramitha Kannimbele
MemberJuly 17, 2020 at 3:14 AM
Sir, first of all, I would like to apologise for my delayed reply, I couldn’t check it yesterday?.
Second of all, I would like to thank you for taking out so much of your time to do this. It has been of great help, really. I tuly do not know what I would have done without these insights.- The measures were slightly inclining towards detached but I fixed it today.
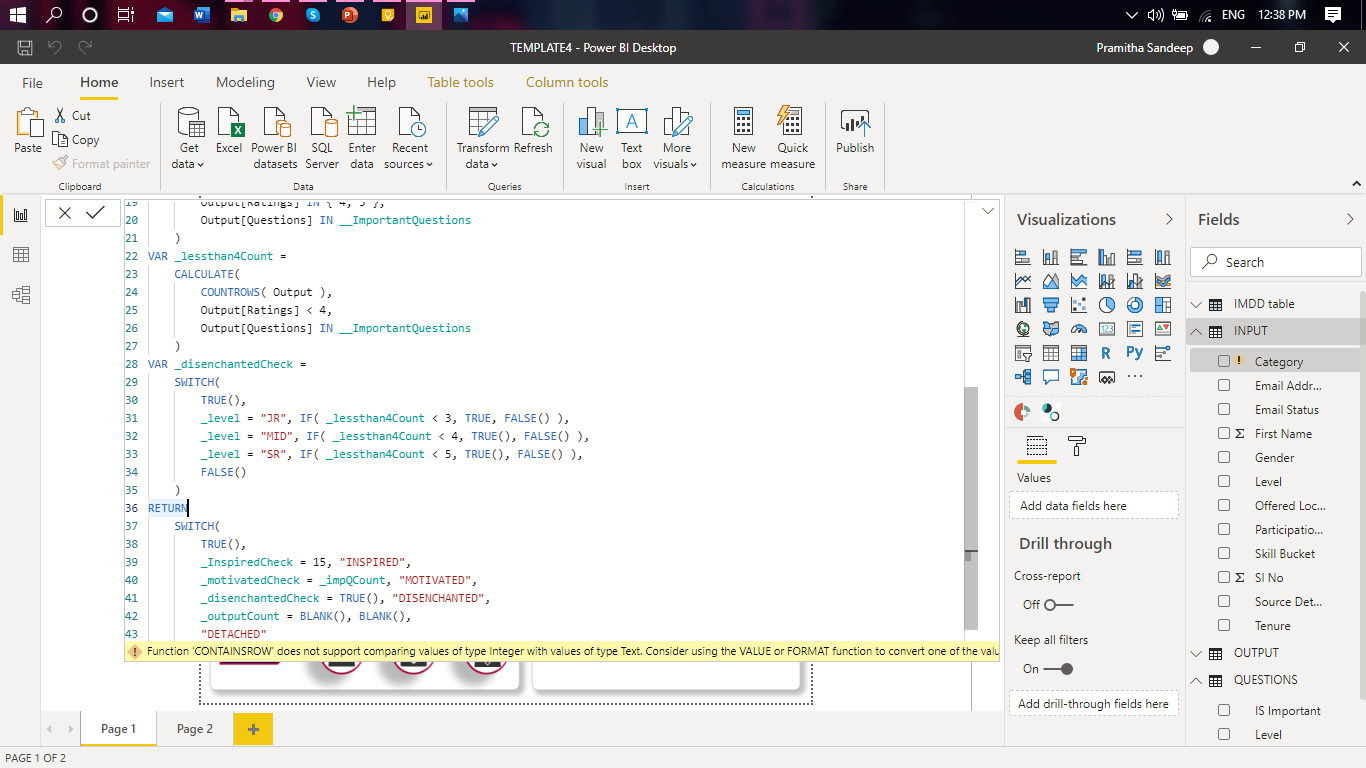
- But the problem is, when I add it to my pbix file, with my tables, I get the above error, which is “Function ‘CONTAINSROW’ does not support comparing values of type Integer with values of type Text. Consider using the VALUE or FORMAT function to convert one of the values.”
- I am attaching both Input, Output Excel sheets and my Power BI file.
Again, thanks for your help so much
——————————
Pramitha Kannimbele
DEVELOPER
——————————
——————————————- - The measures were slightly inclining towards detached but I fixed it today.
-
Gopa Kumar Sivadasan
MemberJuly 17, 2020 at 11:32 AM
HiI had a look at your pbix. The issue is that the datatype of column [Questions] in the ‘OUTPUT’ table is text while the column in [Qno] in the ‘QUESTIONS’ table is an integer. Hence, the check in the code (Output[Questions] IN __ImportantQuestions) compares two columns with different data types which is not allowed. Hence, either add ‘Q’ in the [Qno] column or remove the Q in the [Questions] column and change it to integer. This will ensure either both are Text or both are Integers. If you ask me, if the ‘Q’ does not add any value to your reports, then change to integer by removing the ‘Q’.
?
——————————
Gopa Kumar
Limner ConsultingNorth Kerala User Group Leader
https://www.pbiusergroup.com/NorthKerala
——————————
——————————————- -
Pramitha Kannimbele
MemberJuly 17, 2020 at 2:13 PM
Thanks again, sir. My report is complete. Thank you very much——————————
Pramitha Kannimbele
DEVELOPER
——————————
——————————————-
DSC Communities replied 5 years, 3 months ago 1 Member · 0 Replies -
-
0 Replies
Sorry, there were no replies found.
The discussion ‘NEW COLUMN using SWITCH & AND’ is closed to new replies.
