
Power Platform
Public Group
Active 10 hours ago
Power Platform
Organizer:
- JOSE Organized by
-
-
New column – projected completion date
-
New column – projected completion date
Posted by donovan-fox on January 2, 2019 at 6:16 pm-
I need some help with some coding. I have a table that contains milestone dates for jobs, and have been able to use these milestone dates to create some key measures, including job duration. I would like to take that data & create a calculated column in my table that would reference the type of job being examined & use the average job duration to project when a job will be completed.
The formula I tried first resulted in a circular dependency (plus, I’m not sure this is using the type of job to find the average):
Date Invoiced Projected = JobDataOnline[Date Call Opened] + CALCULATE(AVERAGE(JobDataOnline[TicketDurationOD])My second version came up with no errors, but after creating some measures to check, I can see it’s not giving me the result I want:
Date Invoiced Projected = JobDataOnline[Date Call Opened] + AVERAGE(JobDataOnline[TicketDurationOD])Here’s a link to some sample data so you can see what I’m working with.
Sample DataThanks in advance for any help with this. I had written a really complicated formula using pivottable calls when I was doing all of this in Excel only, so I’m sure it’s possible and I’m just not seeing it.
——————————
Donovan Fox
Supply Chain Specialist
Apprentice Information Systems
Rogers, AR
—————————— -

Vishesh Jain
MemberJanuary 3, 2019 at 3:36 AM
Hi ?,From what I understood from your problem is that you are getting a scalar value in the calculation of your average and so your answer is coming out to be 69 for every single row, but you need to calculate the average of every single category.
In total you will need to apply 3 filters in the calculation of your average, the explanations for which are below:
1. Type Filter
2. Date Filter
3. Ticket Closed1. Type Filter:
This should be a simple one, as you want to calculate the average by type, you need a type filter.2. Date Filter
In your approach, the average will always keep on changing as when new data is added, the system will take into consideration all that data and calculate a new average.
So you also need to apply a filter on the date as well, so that your average stays the same, even when new data is added. For this we will take only the values where your date is less than or equal to the current date.
I chose to apply the filter on the ‘Date Call Opened’, so that when calculating the average it takes into consideration only the dates that are on or before the ‘Date Call Opened’.3. Ticket Closed
For your average, you only want to take into consideration the tickets that have been closed. So, we use only the rows where, the ‘Average duration’ column is not blank.To summarize everything, to calculate the average, we filter the entire table by type, then by dates which are on or before the current date and where the ticket is closed.
You can use this formula to get this result:
Average =
CALCULATE(
    AVERAGE('in'[Average of TicketDurationOD]),
    FILTER('in', 'in'[Date Call Opened] <= EARLIER('in'[Date Call Opened])),
    FILTER('in', 'in'[Type] = EARLIER('in'[Type])),
    FILTER('in', NOT(ISBLANK('in'[Average of TicketDurationOD])))
    )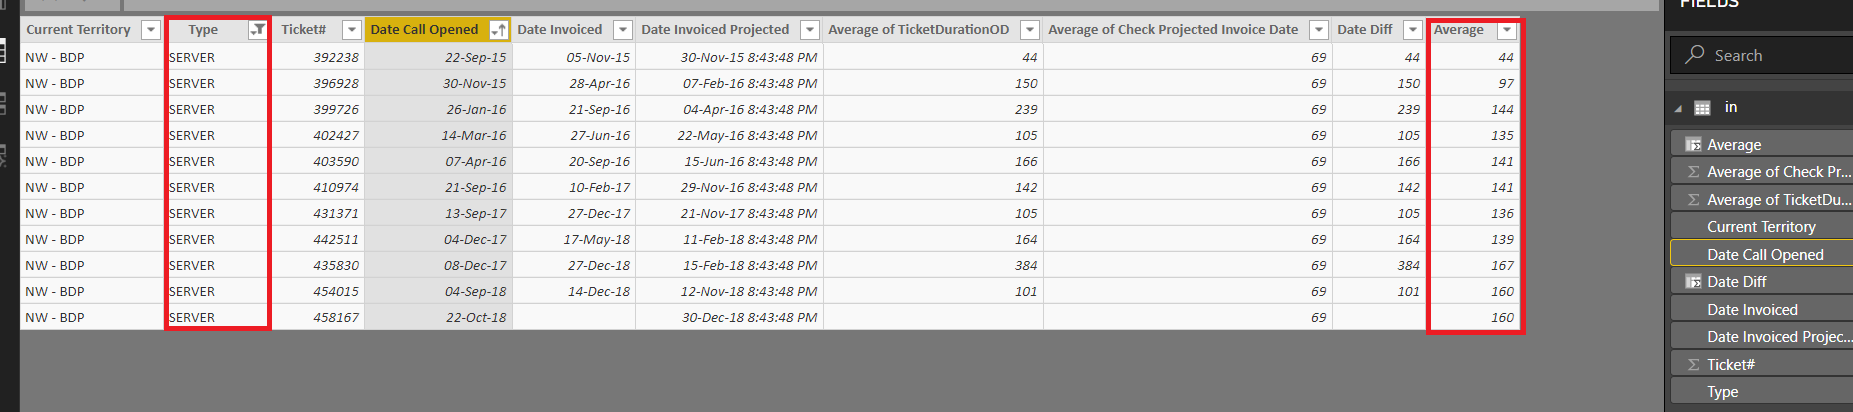
You can use different columns for filtering from the columns that I have used in order to get the desired result.This way my approach to the problem, from what I have understood from your question.
Please let me know if I am missing something out here.Hope this helps resolve your issue.
Thank you,
——————————
Vishesh Jain
Owner
VR Construction
——————————
——————————————- -
Vishesh Jain
MemberJanuary 3, 2019 at 3:40 AM
Sorry I forgot to attach my files here.Thank you,
——————————
Vishesh Jain
Owner
VR Construction
——————————
——————————————- -
Hi Donovan.
Another option:

——————————
Harry Arends
Volkshuisvesting Arnhem
Arnhem
0263712712
——————————
——————————————- -
Thank you & ! I think I’m going to use a blend of both of your calculations to pull this together. Vishesh, your method was really robust, and the filters are going the direction I was leaning, so I think I’ll be able to put those to great use. Harry, your method was very straightforward, which makes a lot of sense to me. I do like the use of measures instead of calculated columns to get the final results too.
I’ll be sure to post my new results here with the final ??expression, once I get a chance to sit down with everything and play.
——————————
Donovan Fox
Supply Chain Specialist
Apprentice Information Systems
Rogers, AR
——————————
——————————————- -
Luis Lopez-Pons
MemberJanuary 3, 2019 at 2:04 PM
In addition to solution, it can be simplified as:
NewAvg =
AVERAGEX (
VALUES ( Tickets[Type] ),
CALCULATE ( SUMX ( Tickets, Tickets[Date Diff] ) )
)Which is the same as
NewAvg =
AVERAGEX (
VALUES ( Tickets[Type] ),
[_Total duration])
)——————————
Luis Lopez-Pons
IT Systems Engineer
——————————
——————————————- -

I was able to get the results for which I was looking, thanks for the guidance.I created a calculated table of the distinct “Types” values, then used the following expression to calculate “New Avg.”
New Avg = CALCULATE(AVERAGEX(JobDataOnline,JobDataOnline[TicketDurationOD])) I then called that value to create a new “Projected Invoice Date” calculated column in my data table.Projected Invoice Date Col = JobDataOnline[Date Call Opened] + CALCULATE(MAXX(Types,Types[New Avg]),JobDataOnline[Type])
Again, thank you for the help!——————————
Donovan Fox
Supply Chain Specialist
Apprentice Information Systems
Rogers, AR
——————————
——————————————- -
Hi Donovan,
If I understand your issue correctly, you want to dynamically be able to calculate an estimated completion time for a given job type based on historic data of how long it has taken. If my understanding is correct, then I have a solution for you.
Using your sample data, I saved this in to Excel (proper) and loaded it in to PBI. I then created a new table in PBI, with a mixture of columns and measures, to filter Job Type, Job Type Count, Job Type Total Days and Job Type Average Days. Then in the Excel data source, I added two calculated columns – the first bringing in the average days for job type based on the job type in the row and then another calculated column to add job type average # of days to the Date Call Opened.
Based on your sample data – the type “PC”, takes on average 80 days, so Row 1 (Ticket #384058) opened 3/6/15, would be projected to be invoiced 5/25/15 – 80 days later.Anyway, this is all good on the basis I understood your issue correctly. I’ve attached for your reference.
Hope this helps.
Happy New Year!!
(PS – there may be better/alternative ways to do this, but this works AFAIK)
??
——————————
Business Program Manager | Identity CxP – Collaborative Engineering Programs
C&AI Identity Division | Microsoft Corporation | Redmond WA
——————————
——————————————- -
Vishesh Jain
MemberJanuary 4, 2019 at 2:26 AM
Hi ,
As per your requirement in the first post, you said “I would like to take that data & create a calculated column in my table…” and specifically asked for a calculated column, which is why my proposed solution had a calculated column.?
Measures are always better than using Calculated Columns as they are dynamic and they don’t take up space in the model.
In your final solution you have created a new table in order to get this calculation, but I would suggest not creating a table, unless you absolutely need it.
New columns and tables unnecessarily bloat up your data model and refreshes take longer.
However, if this is what you want and if you are getting your desired solution, then definitely go for it.
Now you have a couple of solutions at your disposal and you can choose either one you like.
Hope your issue is resolved now.
Thank you,
——————————
Vishesh Jain
Owner
VR Construction
——————————
——————————————-
donovan-fox replied 6 years, 9 months ago 1 Member · 0 Replies -
-
0 Replies
Sorry, there were no replies found.
The discussion ‘New column – projected completion date’ is closed to new replies.
