
Power Platform
Public Group
Active 2 hours ago
Power Platform
Organizer:
- JOSE Organized by
-
-
Need help visualising hierarchies
-
Need help visualising hierarchies
Posted by DSC Communities on December 2, 2019 at 10:46 am-

Tom Worthington
MemberDecember 2, 2019 at 10:46 AM
Hi All,
I was hoping someone would be able to help me with a problem I’ve been having whilst trying to create an org chart hierarchy to visualise in a Power BI report.
I am trying to show ALL of the employees who are subordinate to the selected employee, however I can only seem to show the direct reports, i.e. the one level below the selected person in the hierarchy. I have created a path of 8 hierarchy levels which all seems to be working fine:
PATH = PATH(‘Driving Licence Checks'[EMPLOYEE_INDEX],’Driving Licence Checks'[PARENT_INDEX])which is then split into 8 hierarchy levels:
Level 1 = LOOKUPVALUE(‘Driving Licence Checks'[NAME],’Driving Licence Checks'[EMPLOYEE_INDEX],
PATHITEM(‘Driving Licence Checks'[PATH],1,1))
I’m trying to display all of the employees under this person in a table, and also get a total in the stacked bar chart: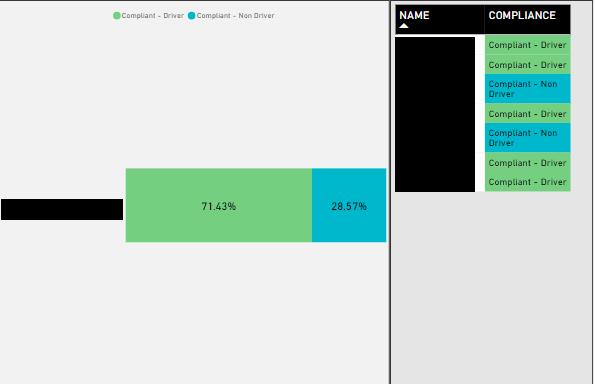
There should be around 38 employees listed in the table given the line manager that I selected, rather than these 7 direct reports.
Any ideas on how to display this properly?
Thanks,
——————————
Tom Worthington
Systems Data Analyst
—————————— -
Rajat Jaiswal
MemberDecember 2, 2019 at 11:07 AM
Dear Tom,A sample PBIX would be a great help to proceed further.
——————————
Rajat Jaiswal
Developer
Indore
——————————
——————————————- -
Tom Worthington
MemberDecember 2, 2019 at 2:19 PM
Hi Rajat,
I have attached a sample .pbix and the corresponding data sets to this message. Going off the (rough) visuals i have created in the report view, I will use the example of the line manager with the employee index ‘6993’. The current report only shows the 7 direct reports from ‘level 4’ of the data set, ‘6993’ being level 3 themselves, however by my count there should be 257 total reports along the hierarchy, reporting to the line manager. Apologies if I haven’t been clear, I’m quite new to this, and thank you for responding!
——————————
Tom Worthington
Systems Data Analyst
——————————
——————————————- -
Rajat Jaiswal
MemberDecember 4, 2019 at 11:57 AM
Dear Tom,Although, I didn’t get the chance to work on your provided pbix but found a useful pbix sample.
Please, find the attached pbix I am sure the sample will help you.
——————————
Rajat Jaiswal
Developer
Indore
——————————
——————————————- -
Neville Howard
MemberDecember 4, 2019 at 6:13 PM
HI Tom,I have not found the Path function suitable to show the data down the full hierarchy. The only way I have found to get the data to display how I wanted it, is to have a column for each level (like you have) but you need a value for every row in every column. I managed to change your vlookup formulas in your level columns to display a value for each column.
I believe it is now showing the data as you require.
——————————
Neville Howard
Consultant
Brisbane
0732228400
——————————
——————————————- -
Tom Worthington
MemberDecember 5, 2019 at 7:21 AM
Hi Neville,
This looks to be what I’m after. Ideally what I would now do, if possible, is to be able to click on each person in that table, and then have another table displaying all the employee numbers of those reporting employees, that is, the ones listed in the Count of EMPLOYEE_NUMBER column. eg. for 6993, another table displaying the employee number of all 258 reportees. Is that possible?
I really appreciate your help with this, thanks for getting me on the right track!
——————————
Tom Worthington
Systems Data Analyst
——————————
——————————————- -
Neville Howard
MemberDecember 8, 2019 at 7:10 PM
Hi Tom,You answered your own question, just without realizing it.
Yes, in the Page 2 of the PBI I sent to you, just add a table visual beside the matrix visual. add the column [employee_number]. Then when you click any item in the matrix, the table is filtered to show the employee numbers related to that ‘position’ in the hierarchy.
regards,
——————————
Neville Howard
Consultant
Brisbane
0732228400
——————————
——————————————- -
Tom Worthington
MemberDecember 10, 2019 at 5:46 AM
Excellent, this is exactly what I’m looking for.Thanks Neville!
——————————
Tom Worthington
Systems Data Analyst
——————————
——————————————- -
Treb Gatte
MemberDecember 4, 2019 at 8:06 PM
Have you looked at this? https://www.daxpatterns.com/parent-child-hierarchies/——————————
Treb Gatte, Data Platform (Power BI) MVP
CEO, MarqueeInsights.com
Bellevue WA
4256543437
——————————
——————————————- -
Tom Worthington
MemberDecember 5, 2019 at 10:26 AM
Hi Treb,That was actually the guide I used to set up my data as it currently stands. It is an excellent guide, however it doesn’t quite have the desired outcome that I am looking for.——————————
Tom Worthington
Systems Data Analyst
——————————
——————————————-
DSC Communities replied 5 years, 10 months ago 1 Member · 0 Replies -
-
0 Replies
Sorry, there were no replies found.
The discussion ‘Need help visualising hierarchies’ is closed to new replies.
