
Power Platform
Public Group
Active 9 hours ago
Power Platform
Organizer:
- JOSE Organized by
-
-
Inflation calculation
-
Inflation calculation
Posted by DSC Communities on October 31, 2022 at 11:20 pm-

Vinu Hari
MemberOctober 31, 2022 at 11:20 PM
Hi All, I have an inflation table against each area, country.
On each anniversary date (i.e. Rate start + 365days or based on the end date) I wanted to add the inflation of 3% to Rate start or ever is indicated in the inflation table.Pls help in doing by DAX
The inflation % can be find in rate table
Ideally, the dax should calculate
if cost is 100
y1 – 100+0%
Y2 – 100+3%
Y3 – 103+3% and so on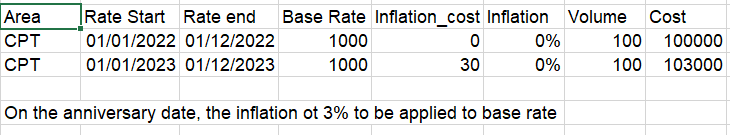
——————————
FA
—————————— -
Adam Artur Boltryk
MemberNovember 1, 2022 at 3:18 PM
Hi,
Add column ‘Rate’ as ‘Base Rate’ + ‘Inflation cost’ and change logic for
‘Base Rate’ = LastYear(‘Rate’)
Also in screenshot you provided (year 2023 data) – if ‘Inflation_cost’ is 30 shouldn’t be ‘Inflation’ 3%, not 0%?you can make it 🙂
Regards,
——————————
Adam Artur Boltryk
Business Analyst
——————————
——————————————- -
Kaz Shakir
MemberNovember 7, 2022 at 2:52 PM
,
I downloaded the .pbix file you attached, but I am having trouble understanding how the values in this file are related to your question.? I am not able to see the columns that you show in your example in the file:- Is the “Area” column in your example, the same as the “Station” column in your file?
- Is the “Inflation” column in your example, the same at the “CPI YOY” column in your file?
- Is the “Base Rate” column in your example, the same as the “List_rate” column in your file?
- I don’t see anything called “Volume” in the file
- If my assumptions above are correct, then for the station = “CPT”, the inflation is never 3%, it’s always 0% – so where is that 3% coming from?
Could you provide some more information so that I can better understand how to use the information in your file to answer your question?
Thanks,
Kaz.——————————
Kaz Shakir
Sr. Program Manager, Asset Planning
TN
——————————
——————————————- -
Kaz Shakir
MemberNovember 11, 2022 at 5:12 PM
,
?I had some time to work on your question today, and here’s what I have been able to come up with. I’m not sure if it addresses your request completely, but I think it gets several of the components you wanted.In order to create the inflation table you wanted, I had to perform a cross join of the values from the Rate Master table with the years from the Calendar table. Then, I filtered out the years that did not apply for each station, and last I created a “period start” and “period end” column to correspond to the example table you provided. Here is the code for this new calculated table:
Table 2 =
SELECTCOLUMNS(
    ADDCOLUMNS(
        FILTER(
            CROSSJOIN(
                DISTINCT('Calendar'[CalYear]),
                DISTINCT(
                    SELECTCOLUMNS(
                        'Rate Master',
                        "Station", 'Rate Master'[Station],
                        "Service Provider", 'Rate Master'[Service provider],
                        "Rate Start", 'Rate Master'[Rate_start],
                        "Rate End", 'Rate Master'[Rate_end],
                        "List Rate", 'Rate Master'[List_rate],
                        "Inflation", 'Rate Master'[CPI YOY]
                    )
                )
            ),
            [CalYear] >= YEAR([Rate Start]) && [CalYear] <= YEAR([Rate End])
        ),
        "Period Start", DATE([CalYear], MONTH([Rate Start]), DAY([Rate Start])),
        "Period End", DATE([CalYear], MONTH([Rate Start]), DAY([Rate Start])) + IF(MOD([CalYear], 4) = 0, 365, 364)
    ),
    "Station", [Station],
    "Service Provider", [Service Provider],
    "Period Start", [Period Start],
    "Period End", [Period End],
    "Base Rate", [List Rate],
    "Inflation", [Inflation]
)?
Then, I created a calculated column in this new table, to determine the first period for this station, like so:
First Period =
VAR thisStation = 'Table 2'[Station]
VAR thisProvider = 'Table 2'[Service Provider]
VAR filteredData =
    FILTER(
        'Table 2',
        'Table 2'[Station] = thisStation && 'Table 2'[Service Provider] = thisProvider
    )
VAR firstPeriod =
    MINX(
        filteredData,
        'Table 2'[Period Start]
    )
RETURN
    firstPeriod
Next, I created a calculated column to determine the Rate at the end of the period (Rate eop) – this is why it was important to know the first period:
Rate eop =
VAR yrsFromStart =
    DATEDIFF('Table 2'[First Period], 'Table 2'[Period Start], YEAR)
VAR thisRate = 'Table 2'[Base Rate]
VAR thisInflation = 'Table 2'[Inflation]
RETURN
    thisRate * POWER(1+thisInflation, yrsFromStart)
And finally, I created the “Inflation_cost” column from your example, like so:
Inflation_cost = 'Table 2'[Rate eop] - 'Table 2'[Base Rate]In the data model I connected this new table to the CC Master table, on the Station field:
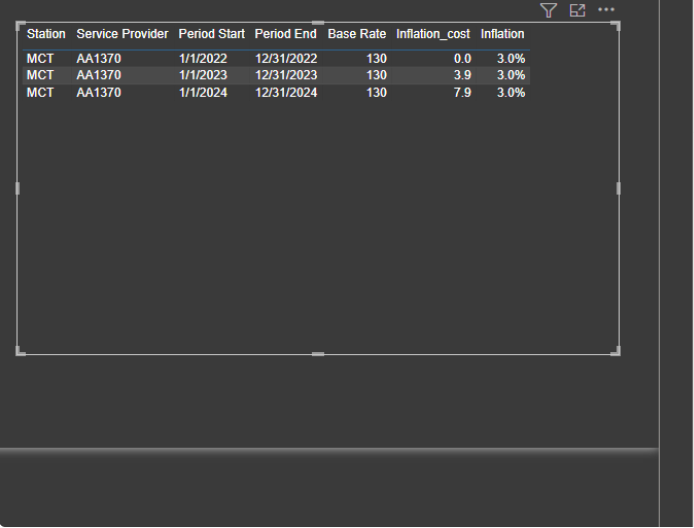
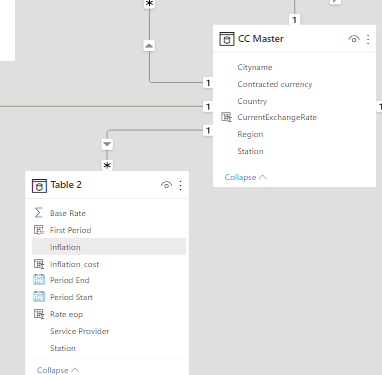 And then I created a simple table using the columns from this new table. In this screenshot, the table is filtered to Station = MCT, and Service Provider = AA1370:
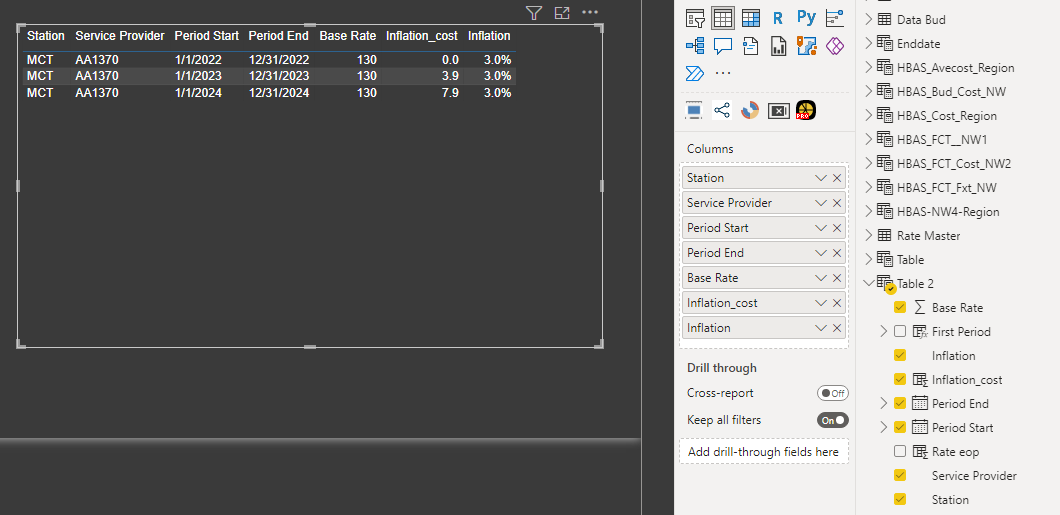
I still was not able to find the column you called “Volume” in your example, so I will leave it up to you to fill in that portion of it.Hope that helps.
Kaz.
——————————
Kaz Shakir
Sr. Program Manager, Asset Planning
TN
——————————
——————————————- -
Vinu Hari
MemberNovember 24, 2022 at 12:52 AM
Hi Kaz, Thanks for your time and effort, one observationin 01/04/24 the base rate should be 133.90 (130+3.9) and inflation should be 4.02 i.e. 133.9 x 3% inflation.
The current dax gives a cumulative cost of 7.92 which is start rate 130 – end rate 137.92 – actually the inflation cost need to be considered only for the financial yearIs it possible to achieve
——————————
FA
——————————
——————————————-
DSC Communities replied 3 years, 5 months ago 1 Member · 0 Replies -
-
0 Replies
Sorry, there were no replies found.
The discussion ‘Inflation calculation’ is closed to new replies.
