
Power Platform
Power Platform
Organizer:
- JOSE Organized by
-
-
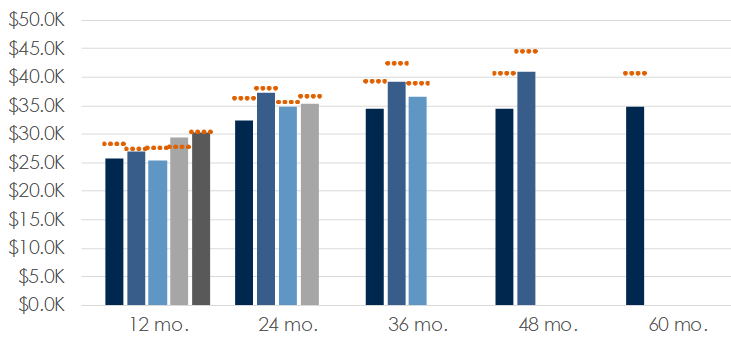
How to create this visual in Power BI
-
How to create this visual in Power BI
Sorry, there were no replies found.
The discussion ‘How to create this visual in Power BI’ is closed to new replies.
