
Power Platform
Public Group
Active 5 hours ago
Power Platform
Organizer:
- JOSE Organized by
-
-
Help Manipulating Data
-
Help Manipulating Data
Posted by DSC Communities on October 30, 2019 at 5:53 pm-

MARTIN BARNES
MemberOctober 30, 2019 at 5:53 PM
I am looking to use Power BI to reformat the data in Exhibit A below to the format in Exhibit B. Any quick tips on how to do that would be greatly appreciated. I have to do this exercise for a large roster of individuals.
——————————
MARTIN BARNES
—————————— -
Audrey Abbey
MemberOctober 30, 2019 at 6:01 PM
Martin,Can you please post Exhibit A in an actual excel workbook and upload?
That way I don’t have to retype everything.The key to this will be the Pivot/Unpivot transforms in the query editor – and possible the transpose table.
But I need to play with it in order to give you the exact steps.——————————
Audrey Abbey
SR. BI Developer/Analyst
LeapFrogBI
Portland OR
——————————
——————————————- -
MARTIN BARNES
MemberOctober 30, 2019 at 6:59 PM
Here you go…thanks for the prompt response Audrey! I uploaded the file.——————————
MARTIN BARNES
——————————
——————————————- -
Audrey Abbey
MemberOctober 30, 2019 at 7:35 PM
File reattached.I tried to label each set of steps so that you would understand what I did.
If you have any questions – please ask.First, I had to deal with the merged cells. I used a transpose, replace blanks will null, then a fill. Then transposed again to put it back.
Second, had to promote the headers and then update one column name, to prepare for the unpivot.
Next, I unpivot and filter out the extra rows.
After that, I prepared the data to be grouped. That required a column split.
Then I grouped by Name and Item – creating a column for Start and End date using min and max aggregations.Hope that helps!
——————————
Audrey Abbey
SR. BI Developer/Analyst
LeapFrogBI
Portland OR
——————————
——————————————- -
MARTIN BARNES
MemberOctober 30, 2019 at 9:35 PM
Abby,Again, thank you for the support. Forgive my ignorance (this is literally my first time using Power BI), but I am unable to view the labels you reference. All I can see is the resultant table you were able to create (see below). Sorry to be such a needy novice but can you tell me how I access the notes you reference, and anything else I am not seeing? Thanks again – Marty

——————————
MARTIN BARNES
——————————
——————————————- -
Audrey Abbey
MemberOctober 30, 2019 at 9:57 PM
We were all novices once. You can’t get better if you don’t ask a bunch of questions. =)Click on the “Edit Queries” icon in your ribbon.
This will take you into the Query Editor, where you can shape your data.You will see the Query name (ExhibitA) in the right panel.
In the middle panel, you will see the actual data.
And in the right panel, you will see the list Applied Steps (screenshot below)Start by Clicking on the step called source. This will show you what your data looked like when I imported it.
Note: Steps prefixed with # are my comments about what the following steps are doing.Next, click on each subsequent step to see how it affected the data.
Each step will correspond with a transformation that you can see either in the menu tabs or by right clicking the column to view the available transform list.
If the step has a gear icon, you can double click (or right click and select Edit Settings) and it will show you the configuration I used.These transforms generate the M code for you in the background.
If you are curious, you can right click on the query name in the left panel and select Advanced Editor to see the entire code.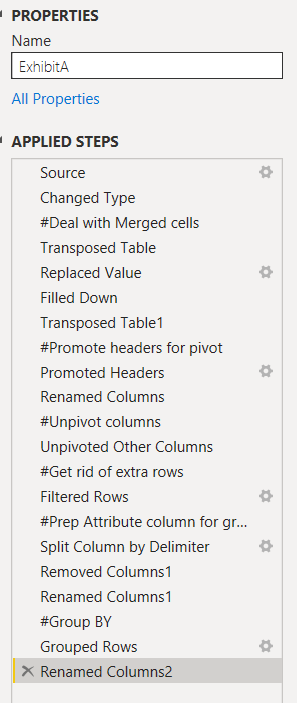
?
——————————
Audrey Abbey
SR. BI Developer/Analyst
LeapFrogBI
Portland OR
——————————
——————————————- -
Juzar Para
MemberNovember 2, 2019 at 10:10 PM
Dear all,Is it possible to provide video of hardwork put to arrange the data, not able to understand step like #Merged data, splitting cell
Regards
Juzar para?
——————————
Juzar Para
——————————
——————————————- -
Audrey Abbey
MemberNovember 6, 2019 at 2:43 PM
Hi Juzar,I am not sure how to do videos, but I am happy to answer any questions.
The merged cells –
In Excel, there were merged cells used as a header for a group of columns.
When you import that into Power BI, it splits the merged cells into columns and the text value only goes in the first column.
I took steps to fill those missing values in so that I could pivot.
This step could have been done manually by renaming the columns, but I wanted to show the original poster how to handle it with the transforms.——————————
Audrey Abbey
SR. BI Developer/Analyst
LeapFrogBI
Portland OR
——————————
——————————————- -
Juzar Para
MemberNovember 6, 2019 at 9:53 PM
Sir,Your instructions were perfect, it took me some time to understand
Thank you
Juzar para
——————————
Juzar Para
——————————
——————————————- -
Mohamed Ibrahim
MemberNovember 7, 2019 at 1:12 AM
This is an less step version based on Audrey’s work for better understanding of folks.——————————
Mohamed Ibrahim
——————————
——————————————- -
Can you share the original table supporting both visuals, please?
——————————
Armando Lacerda
Senior Cloud and BI Architect
San Francisco CA
——————————
——————————————-
DSC Communities replied 5 years, 10 months ago 1 Member · 0 Replies -
-
0 Replies
Sorry, there were no replies found.
The discussion ‘Help Manipulating Data’ is closed to new replies.
