
Power Platform
Public Group
Active 2 days ago
Power Platform
Organizer:
- JOSE Organized by
-
-
Cohort Matrix Analysis
-
Cohort Matrix Analysis
Posted by DSC Communities on May 7, 2021 at 6:44 pm-

Mark Soares
MemberMay 7, 2021 at 6:44 PM
Hello,
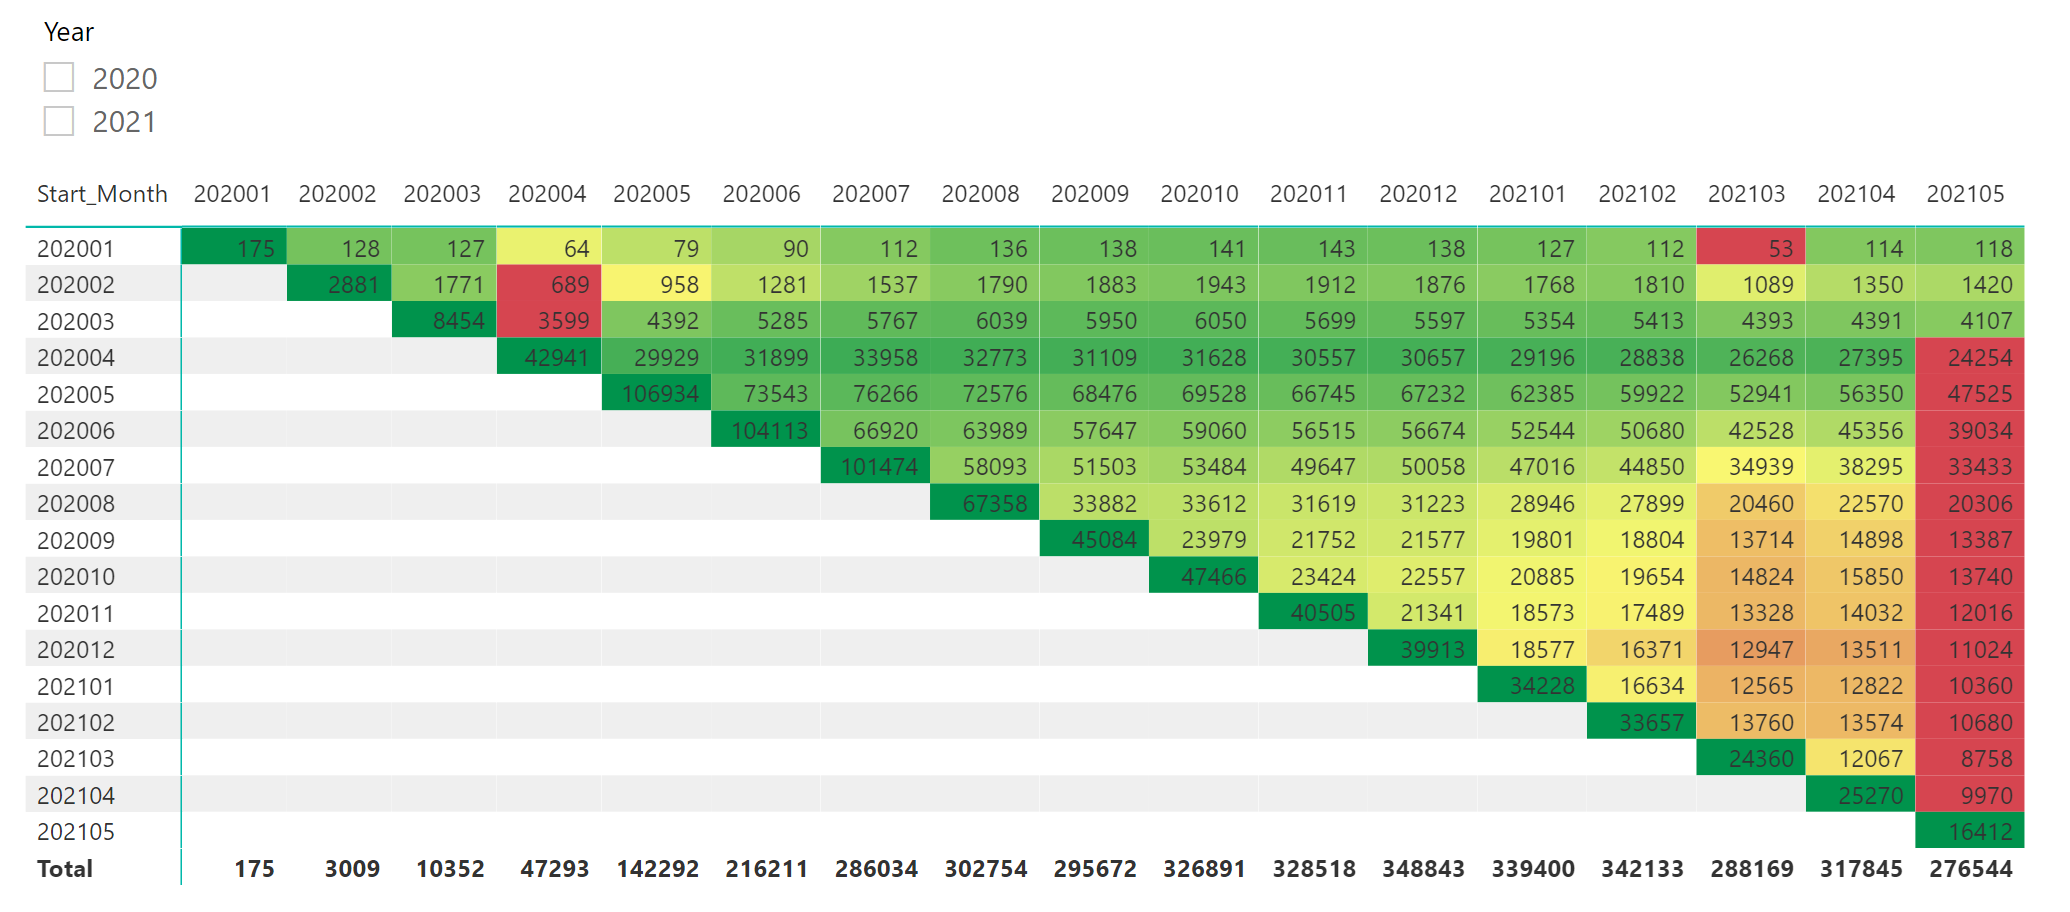
Can someone help and guide me with creation of appropriated DAX functions to build the below cohort Matrix visualization?
I am also attaching the database example, but it does not match exactly the below numbers.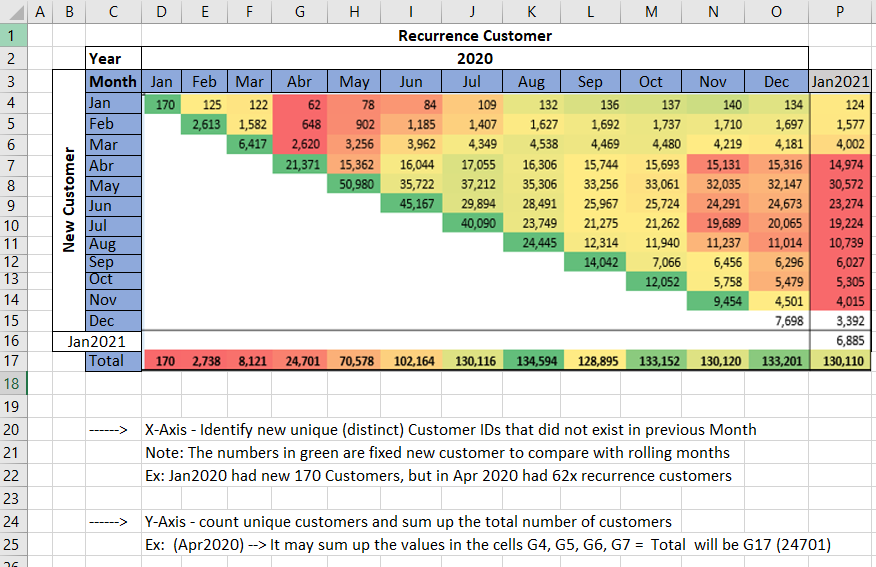
Thank you
Marco
——————————
Mark Soares
BI Analist
Campinas
—————————— -
Gopa Kumar Sivadasan
MemberMay 14, 2021 at 11:25 AM
HiPlease see if the below helps you.
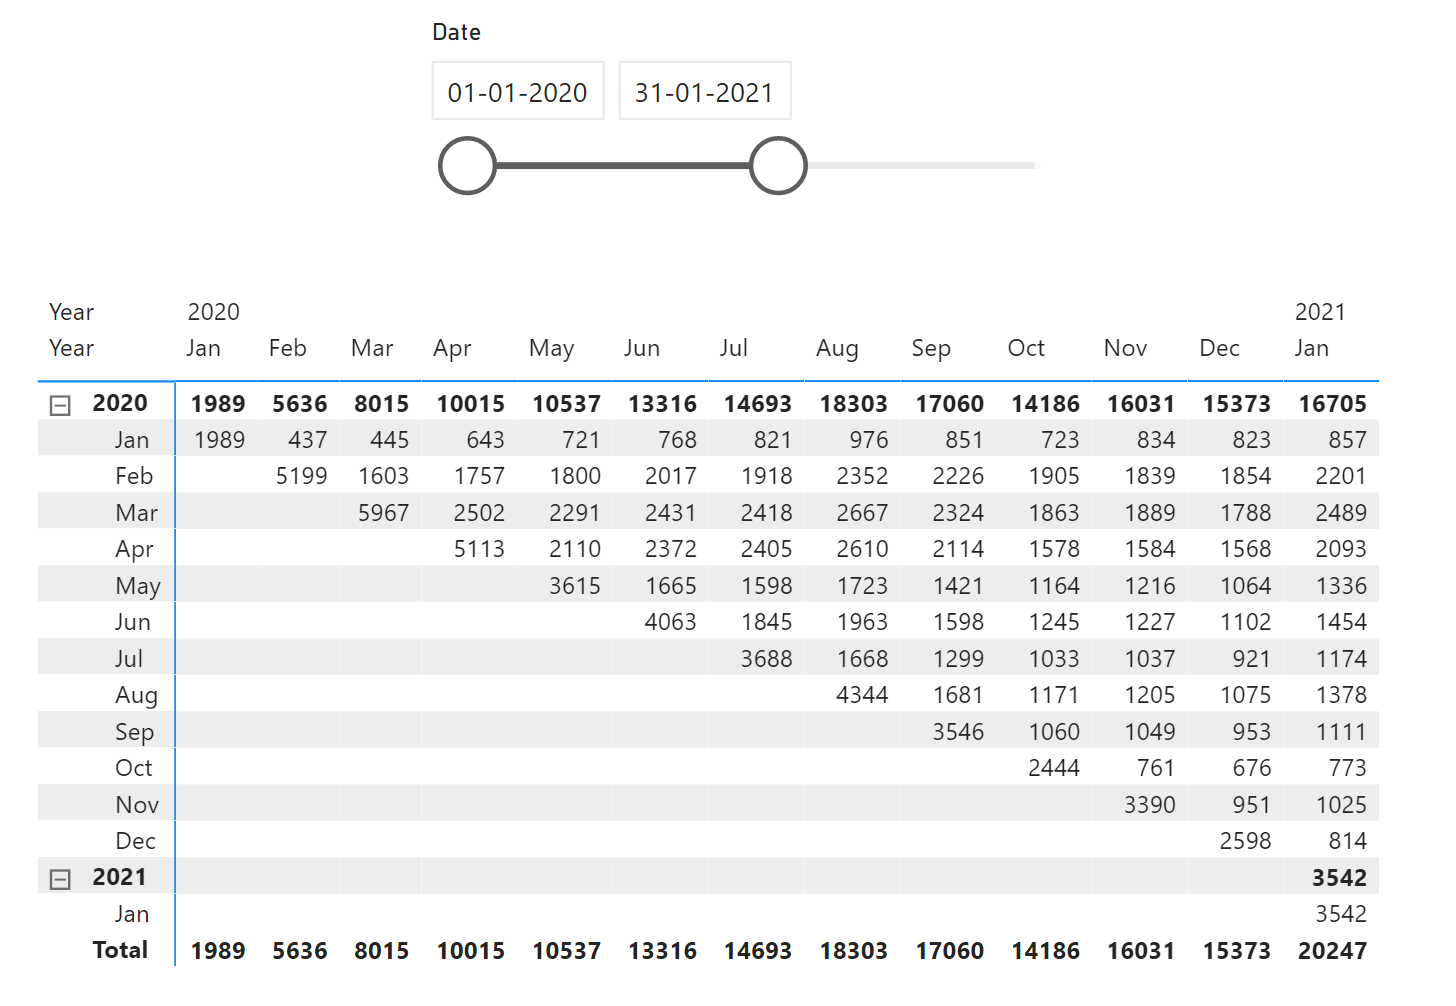
Had to do the following:
- Created a duplicate date table to put the months on the Y axis
- Created a ‘Start of Month’ column in both the date tables and the Fact table
- Used the below DAX measure to calculate the relevant cohort values.
?
Cohort Value =
VAR _currentcolumnSOM =
    SELECTEDVALUE ( 'Date Table'[Month Start] )
-----------------------------------------
VAR __summarytable =
    SUMMARIZE (
        'Alt Date Table',
        'Alt Date Table'[Month Start],
        "@customercount",
            VAR _currentrowSOM =
                SELECTEDVALUE ( 'Alt Date Table'[Month Start] )
            VAR __rlvntable1 =
                CALCULATETABLE (
                    VALUES ( Table1[Customer ID] ),
                    Table1[StartofMonth] = _currentcolumnSOM
                ) --1st take the customer ids based on column SOM
            VAR __rlvntable2 =
                CALCULATETABLE (
                    VALUES ( Table1[Customer ID] ),
                    Table1[StartofMonth] = _currentrowSOM
                ) --2nd take the customer ids based on row SOM
            VAR __rlvntable3 =
                CALCULATETABLE (
                    VALUES ( Table1[Customer ID] ),
                    Table1[StartofMonth] < _currentrowSOM
                ) --3rd take the cumulative customer ids based on row SOM < current row SOM
            VAR __rlvntable4 =
                FILTER ( __rlvntable2, NOT ( Table1[Customer ID] IN __rlvntable3 ) ) --4th remove from 2nd the customer ids which are there in 3rd. This gives the unique customers for each row SOM
            VAR __rlvntable5 =
                FILTER ( __rlvntable4, Table1[Customer ID] IN __rlvntable1 ) --5th find the customer ids in 4th which are there in 1st. The customers IDs of row SOM which is still present in the column SOM.
            RETURN
                COUNTROWS ( __rlvntable5 )
    )
-----------------------------------------------
RETURN
    SUMX ( __summarytable, [@customercount] )
?
PFA the pbix file also.
——————————
Gopa Kumar
Limner Consulting
North Kerala User Group Leader
https://www.pbiusergroup.com/NorthKerala
——————————
——————————————- -
Mark Soares
MemberMay 14, 2021 at 12:18 PM
Hi Gopa Kumar,
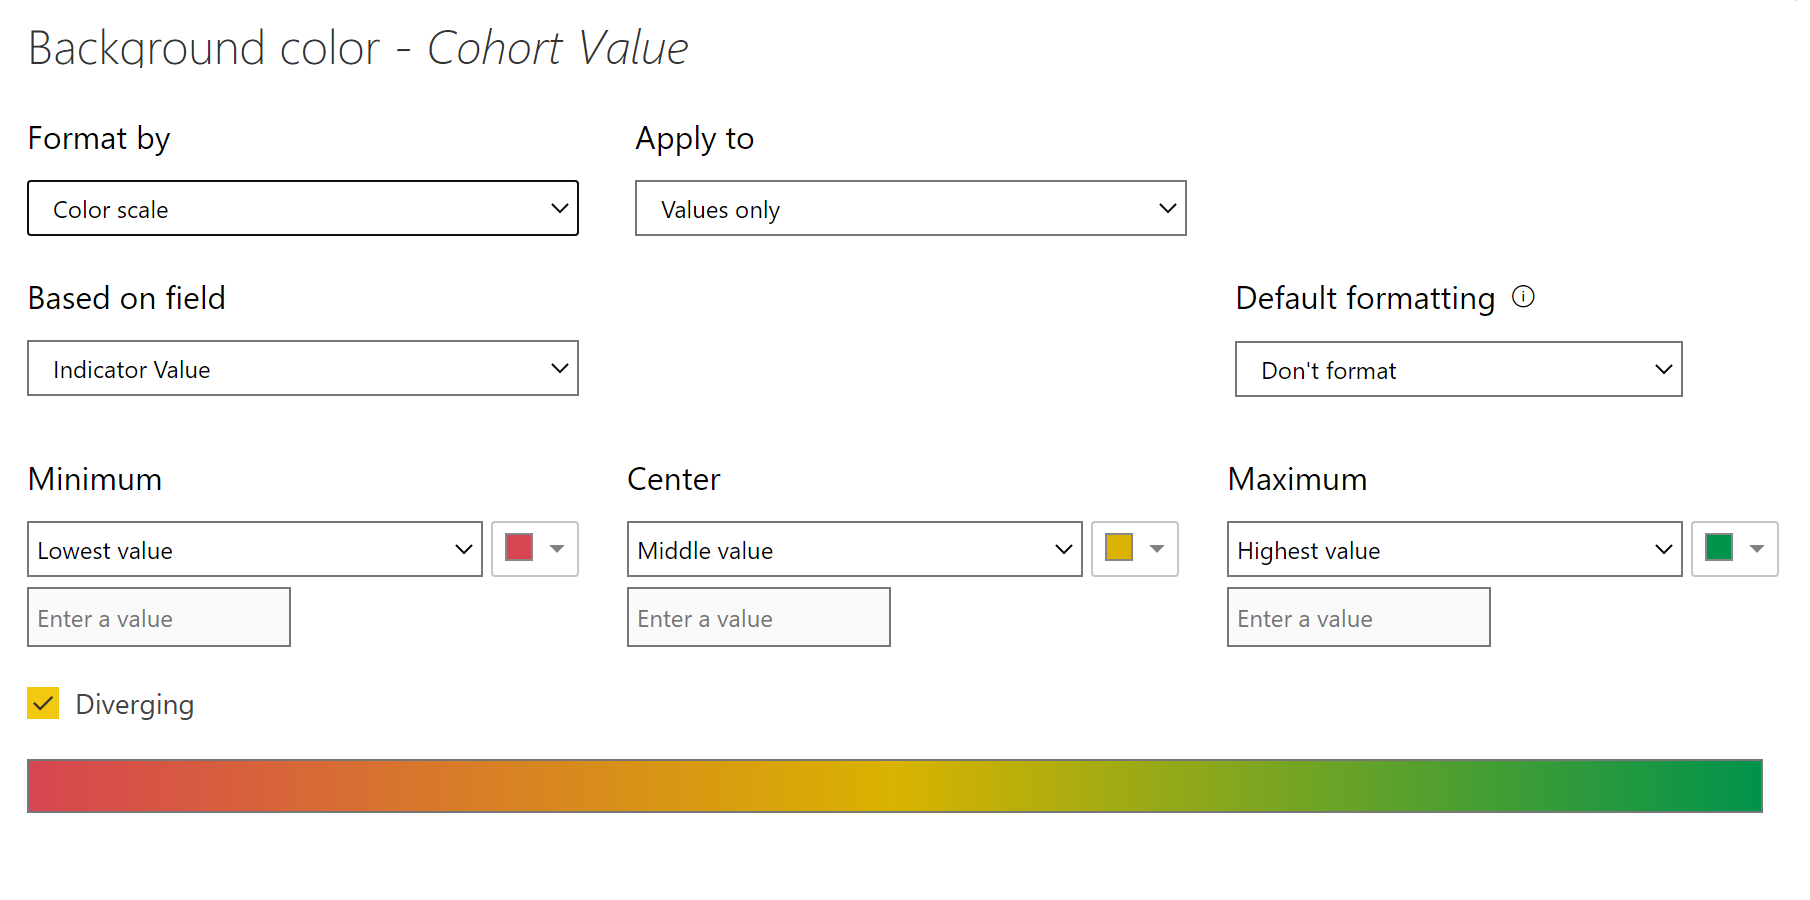
Thank you very much for the response and feedback with resolution.One more question related color conditional visualization into Matrix table. When I try to apply the background color formatting, the rules only apply into entire matrix.
Is it possible under DAX expression to apply the color scale per each line separately?
For example, according to the January reference below, I need to apply the color scaling as lowest vale= Red; Middle Value = Yellow and Highest Value = Green.
And also apply to the next Month lines separately.
Best Regards,
Mark——————————
Mark Soares
BI Analist
Campinas
——————————
——————————————- -
Gopa Kumar Sivadasan
MemberMay 16, 2021 at 5:00 PM
HiPlease see if the below helps you. I have not been able to conditionally format the totals. Someone else may be able you help you.
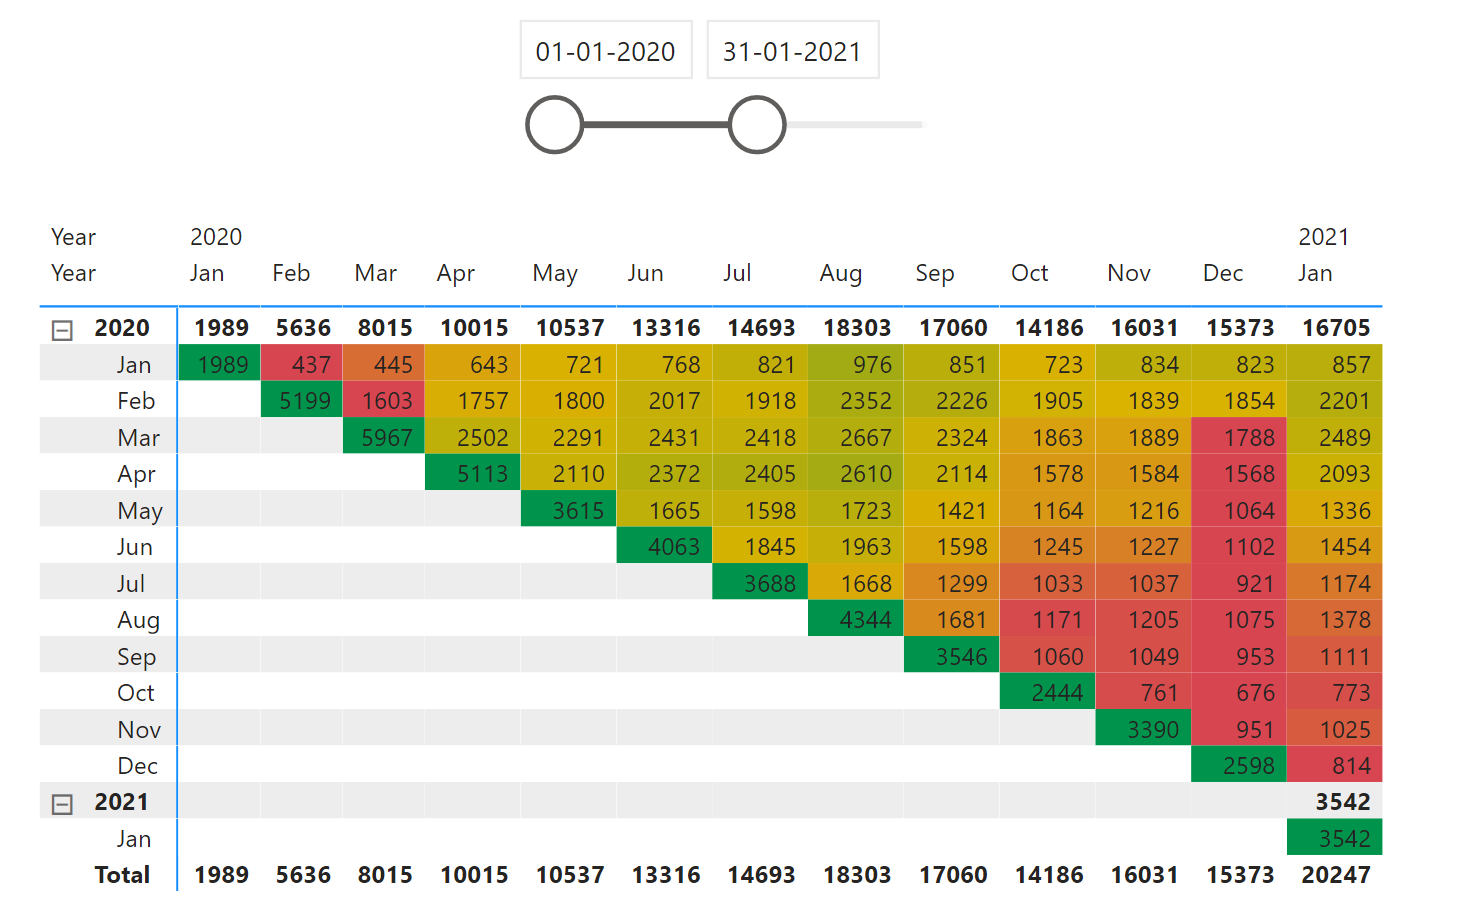
I am not aware how to conditionally format selectively per row in the matrix as you may be able to do in excel. Alternatively, the solution implemented here calculates a measure which generates a ratio which is trying to mimic the selective per row formatting. The approximation ratio is based on the following logic:
- Calculate the standard deviation of each row.
- In each row assign 1 to the highest value and 0 to the minimum value.
- For values other than the minimum and maximum, calculate the ratio using the formula Absolute of 1-(standard deviation/current cell value)
DAX for the indicator measure
Indicator Value =
VAR _currentcolumn =
    SELECTEDVALUE ( 'Date Table'[Month Start] )
VAR _currentrow =
    SELECTEDVALUE ( 'Alt Date Table'[Month Start] )
--------------------------------------------------------------
VAR _proportion =
    IF (
        _currentrow > _currentcolumn,
        BLANK (),
        --run this only in the relevant cells
        -----------------------------
        VAR _currentcohortvalue = [Cohort Value]
        VAR _maxSOM =
            CALCULATE ( MAX ( 'Date Table'[Month Start] ), ALLSELECTED ( 'Date Table' ) )
        VAR _minSOM =
            CALCULATE ( MIN ( 'Date Table'[Month Start] ), ALLSELECTED ( 'Date Table' ) )
        -----------------------------
        VAR __rlvntSOMtable1 =
            CALCULATETABLE (
                VALUES ( 'Date Table'[Month Start] ),
                ALLSELECTED ( 'Date Table' ),
                'Date Table'[Month Start] >= _minSOM
                    && 'Date Table'[Month Start] <= _maxSOM
            ) --build a table with all the start month values in the slicer selection ignoring the filter from the start month column in the matrix
        VAR __rlvntSOMtable2 =
            SELECTCOLUMNS (
                __rlvntSOMtable1,
                "@MonthStart", 'Date Table'[Month Start] & ""
            ) --remove the lineage to the date table
        -------------------------------------------------------------------------------------
        --create a temp table with the cust count for all the columns in the current row
        VAR __ranktable =
            ADDCOLUMNS (
                __rlvntSOMtable2,
                "@custcount",
                    VAR _currentrowSOM =
                        SELECTEDVALUE ( 'Alt Date Table'[Month Start] )
                    VAR _currentcolumnSOM =
                        DATEVALUE ( [@MonthStart] ) --since this is in text format bcoz of the addition of "" to remove lineage, convert it back to date value
                    VAR __rlvntable1 =
                        CALCULATETABLE (
                            VALUES ( Table1[Customer ID] ),
                            Table1[StartofMonth] = _currentcolumnSOM
                        ) --1st take the customer ids based on column SOM
                    VAR __rlvntable2 =
                        CALCULATETABLE (
                            VALUES ( Table1[Customer ID] ),
                            Table1[StartofMonth] = _currentrowSOM
                        ) --2nd take the customer ids based on row SOM
                    VAR __rlvntable3 =
                        CALCULATETABLE (
                            VALUES ( Table1[Customer ID] ),
                            Table1[StartofMonth] < _currentrowSOM
                        ) --3rd take the cumulative customer ids based on row SOM < current row SOM
                    VAR __rlvntable4 =
                        FILTER ( __rlvntable2, NOT ( Table1[Customer ID] IN __rlvntable3 ) ) --4th remove from 2nd the customer ids which are there in 3rd. This gives the unique customers for each row SOM
                    VAR __rlvntable5 =
                        FILTER ( __rlvntable4, Table1[Customer ID] IN __rlvntable1 ) --5th find the customer ids in 4th which are there in 1st. The customers IDs of row SOM which is still present in the column SOM.
                    RETURN
                        COUNTROWS ( __rlvntable5 )
            )
    --------------------------------------------------------------------------------
        VAR __ranktable2 =
            FILTER ( __ranktable, [@custcount] <> BLANK () ) --filter out rows which has blank customer counts (rows where SOM < current column date)
        --------------
        --filter the table for the current cell
        VAR __rlvntranktable =
            FILTER ( __ranktable2, [@MonthStart] = _currentcolumn & "" ) -- & "" as [@MonthStart] is string caused by the breakage of lineage
        -----------------------------------------------------------
        --calculation of the proportion
        VAR _stddeviation =
            STDEVX.P ( __ranktable2, [@custcount] )
        VAR _maxcount =
            MAXX ( __ranktable2, [@custcount] )
        VAR _mincount =
            MINX ( __ranktable2, [@custcount] )
        VAR _currentcellcount =
            MAXX ( __rlvntranktable, [@custcount] )
        VAR _countproportion =
            SWITCH (
                TRUE (),
                _currentcellcount = _maxcount, 1,
                _currentcellcount = _mincount, 0,
                ABS ( 1 - DIVIDE ( _stddeviation, _currentcellcount, BLANK () ) ) --absolute value
            )
        ---------------------------------------------------------
        RETURN
            _countproportion
    )
RETURN
    _proportion
This measure is then used in the conditional formatting of the visual.
PFA the pbix also for your reference.
——————————
Gopa Kumar
Limner Consulting
North Kerala User Group Leader
https://www.pbiusergroup.com/NorthKerala
——————————
——————————————- -
Mark Soares
MemberMay 21, 2021 at 3:51 PM
Hi Gopa Kumar,
Thank again for great helps.
I’ve tried to replicate the same cohort indicator logic that you created, using the new sample and fields data already aggregated per attached xlsx, but didn’t work.
the new attached PBI file contains the matrix I built with color conditional, is it necessary to replicate and create auxiliar tables?
Are you able again to create the DAX rules for color condition in the file?Best Regards,
Mark——————————
Mark Soares
BI Analist
Campinas
——————————
——————————————- -
Gopa Kumar Sivadasan
MemberMay 22, 2021 at 1:40 AM
HiI am sorry but your current structure is entirely different from the one initially posted. I will not have time immediately to look into this. Maybe someone else can help you in the meantime.
?
——————————
Gopa Kumar
Limner Consulting
North Kerala User Group Leader
https://www.pbiusergroup.com/NorthKerala
——————————
——————————————- -
Mark Soares
MemberMay 22, 2021 at 10:14 AM
Hi Gopa Kumar,
You are correct. The base table is different from previous one. Really sorry for any inconvenience cause.
The second one provided has a aggregated and calculated number for cohort values applied under a huge data base in SQL , but when I try to apply Dax color rules, it is so difficult with what correct rules to apply like you did with DAX indicator value.Thanks in advance
RegardsMark——————————
Mark Soares
BI Analist
Campinas
——————————
——————————————- -
Gopa Kumar Sivadasan
MemberMay 23, 2021 at 10:01 AM
HiPlease see if the below helps you.
?Dax for the Indicator
Indicator =
VAR _currentcolumn =
    SELECTEDVALUE ( Planilha1[Current_Month] )
VAR _currentrow =
    SELECTEDVALUE ( Planilha1[Start_Month] )
-------------------------------
VAR _proportion =
    IF (
        _currentrow > _currentcolumn,
        BLANK (),
        --run this only in the relevant cells
        VAR _maxcolumnmonth =
            CALCULATE (
                MAX ( Planilha1[Current_Month] ),
                ALLSELECTED ( Planilha1[Current_Month] ),
                REMOVEFILTERS ( Planilha1[Start_Month] )
            ) --get the max value ignoring filters from the matrix
        VAR _mincolumnmonth =
            CALCULATE (
                MIN ( Planilha1[Current_Month] ),
                ALLSELECTED ( Planilha1[Current_Month] ),
                REMOVEFILTERS ( Planilha1[Start_Month] )
            ) --get the min value ignoring filters from the matrix
        --------------------------------------
        VAR __rlvntcolumntable =
            CALCULATETABLE (
                VALUES ( Planilha1[Current_Month] ),
                ALL ( Planilha1[Current_Month], Planilha1[Start_Month] ),
                Planilha1[Current_Month] >= _mincolumnmonth
                    && Planilha1[Current_Month] <= _maxcolumnmonth
            ) -- --build a table with all the start month values in the slicer selection ignoring the filter from the current month column in the matrix
        VAR __rlvntcolumntable2 =
            SELECTCOLUMNS (
                __rlvntcolumntable,
                "@currentmonth", Planilha1[Current_Month] & ""
            ) --remove the lineage to the Planilha table
        VAR __rlvntcolumntable3 =
            ADDCOLUMNS (
                __rlvntcolumntable2,
                "@qty",
                    VAR _currentcolumnmonth =
                        VALUE ( [@currentmonth] )
                    RETURN
                        CALCULATE (
                            MAX ( Planilha1[QTY] ),
                            ALL ( Planilha1[Current_Month], Planilha1[Start_Month] ),
                            Planilha1[Current_Month] = _currentcolumnmonth,
                            Planilha1[Start_Month] = _currentrow
                        )
            ) --create a temp table with the Qty for all the columns in the current row
        VAR __rlvntcolumntable4 =
            FILTER ( __rlvntcolumntable3, [@qty] <> BLANK () ) --filter out rows which has blank customer counts (rows where row month < current column month)
        --------------------------------------
        --calculation of the proportion
        VAR _stddeviation =
            STDEVX.P ( __rlvntcolumntable4, [@qty] )
        VAR _maxqty =
            MAXX ( __rlvntcolumntable4, [@qty] )
        VAR _minqty =
            MINX ( __rlvntcolumntable4, [@qty] )
        VAR _currentcohortvalue =
            SELECTEDVALUE ( Planilha1[QTY] )
        VAR _currentproportion =
            SWITCH (
                TRUE (),
                _currentcohortvalue = _maxqty, 1,
                _currentcohortvalue = _minqty, 0,
                ABS ( 1 - DIVIDE ( _stddeviation, _currentcohortvalue, BLANK () ) )
            ) --absolute value
        RETURN
            _currentproportion
    )
RETURN
    _proportion
?
PFA the pbix file for your reference.
——————————
Gopa Kumar
Limner Consulting
North Kerala User Group Leader
https://www.pbiusergroup.com/NorthKerala
——————————
——————————————- -
Mark Soares
MemberMay 25, 2021 at 8:40 AM
Hi Gopa Kmuar,
This is incredible. Many thanks for your prompt help and support.
It is exactly what I was expecting.Best Regards,
——————————
Mark Soares
BI Analist
Campinas
——————————
——————————————- -
Mark Soares
MemberJune 18, 2021 at 12:42 PM
Hi Gopa Kumar,
Could you help once more please with indicator DAX ?
I’ve replicated your dax indicator in my new xls file (expecting to be the final) that my IT provided, but according to pbi results attached, I have some question:– I have noticed that some row and column from matrix are no matching the color scale criteria expected. Ex: Row(Jan) X Column (1 and 2) – They are as green scale but the correct would be as red. But you can see more incorrect colors in the pbi. I guess that year filter should be consider in the indicator DAX. Can you confirm if so and what would be the correct place to include this filter in the dax?
– Related to columns 1 until 12 numbers, that means the Months of Year, I tried to use Months abreviation instead, but indicator does not work with “selectvalue” function used. What would be the correct one to use with months Abrev.?
– How the dax indicator expression works when we have negative or percentage numbers format? Is it neessary additional adjustment in the DAX ?
Thanks in advance.
Mark——————————
Mark Soares
BI Analist
Campinas
——————————
——————————————-
DSC Communities replied 4 years, 11 months ago 1 Member · 0 Replies -
-
0 Replies
Sorry, there were no replies found.
The discussion ‘Cohort Matrix Analysis’ is closed to new replies.
