Allow user to choose hierarchy level displayed (date-based)?

  • Allow user to choose hierarchy level displayed (date-based)?

    Posted by Unknown Member on January 17, 2018 at 5:58 pm
    • Mark Evans

      Member

      January 17, 2018 at 5:58 PM

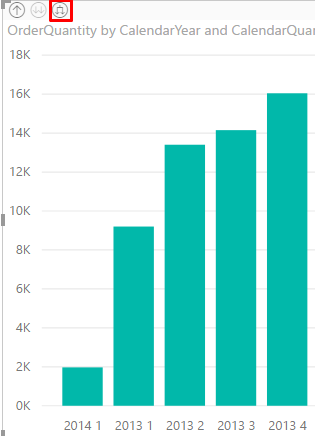
      I’m thinking that this isn’t easily possible, but was hoping to allow the user to choose whether to view a bar chart by year, month, quarter, date. The integrated drill-down will sort of do that, but also filters that viz to just the selected time period. This is confusing to me, because the rest of the page vizzes don’t have the same filter applied and I have a date slicer for that.

      It would be really nice to allow the user to view the full selected time frame (as set by the date slicer) in the buckets that make sense. If anyone knows how to do this, I’d appreciate the tip!

      Thanks!

      Mark

      ——————————
      Mark Evans
      Data Analyst
      Big Bytes LLC
      Ann Arbor MI
      7349944109
      ——————————

    • Roman Kuznetsov

      Member

      January 18, 2018 at 2:29 AM

      Hi! Doesn’t the button “expand all” help?

      ?

      ——————————
      Roman Kuznetsov
      olap dev
      smith821@gmail.com
      123456789
      ——————————
      ——————————————-

    • Mark Evans

      Member

      January 19, 2018 at 6:15 PM

      Thanks – yes, that is basically what I was looking for and I’m not clear how I missed it. I got deep into the drill-down via clicking on the bars themselves, which changed the display period. I missed the “Expand all down one level in the hierarchy” control. Thanks for responding.

      ——————————
      Mark Evans
      Data Anlayst
      Big Bytes LLC
      Ann Arbor MI
      7349944109
      ——————————
      ——————————————-

    • Barry Crowell

      Member

      January 18, 2018 at 9:33 AM

      Mark,

      I’m thinking this is what your trying to do.Ā  Dynamic X axis on charts – Power BI

      Radacad remove preview
      Dynamic X axis on charts – Power BI
      A recent post to the Power BI community desktop forums asked if it might be possible to allow a user to make a slicer selection that dynamically updates the x-axis.
      View this on Radacad >

      Dynamic X axis on charts – Power BI

      Radacad remove preview
      Dynamic X axis on charts – Power BI
      A recent post to the Power BI community desktop forums asked if it might be possible to allow a user to make a slicer selection that dynamically updates the x-axis.
      View this on Radacad >

      http://radacad.com/dynamic-x-axis-on-charts-power-biĀ Ā 

      ——————————
      Barry Crowell
      Senior Business Consultant
      KTL Solutions, Inc
      Frederick MD
      301-360-0001
      ——————————
      ——————————————-

    • Janet Hutton

      Member

      January 19, 2018 at 8:29 AM

      ?I feel like you could do this using bookmarks.Ā Ā  Check out this video from Guy in a Cube.Ā  It is a clever solution.Ā Ā Ā 

      Guy in a Cube video on bookmarks with toggles

      There was also a contest in December for creative uses of bookmarks.Ā Ā  The winning entries may help to inspire your creativity.Ā 

      https://powerbi.microsoft.com/en-us/blog/congratulations-to-the-winners-of-the-bookmarking-feature-contest/

      ——————————
      Janet Hutton
      Director, Business Intelligence
      L’Oreal
      Berkeley Heights NJ
      9088098192
      ——————————
      ——————————————-

    Unknown Member replied 7 years, 8 months ago 1 Member · 0 Replies
  • 0 Replies

Sorry, there were no replies found.

The discussion ‘Allow user to choose hierarchy level displayed (date-based)?’ is closed to new replies.

Start of Discussion
0 of 0 replies June 2018
Now

Welcome to our new site!

Here you will find a wealth of information created for peopleĀ  that are on a mission to redefine business models with cloud techinologies, AI, automation, low code / no code applications, data, security & more to compete in the Acceleration Economy!