
Dynamics Business Central (NAV)
Public Group
Active a day ago
Experts:
2015 Service Tier Memory Help
-
2015 Service Tier Memory Help
Posted by DSC Communities on December 21, 2016 at 4:59 pm-

Matthew McGinley
MemberDecember 21, 2016 at 4:59 PM
Hello All!
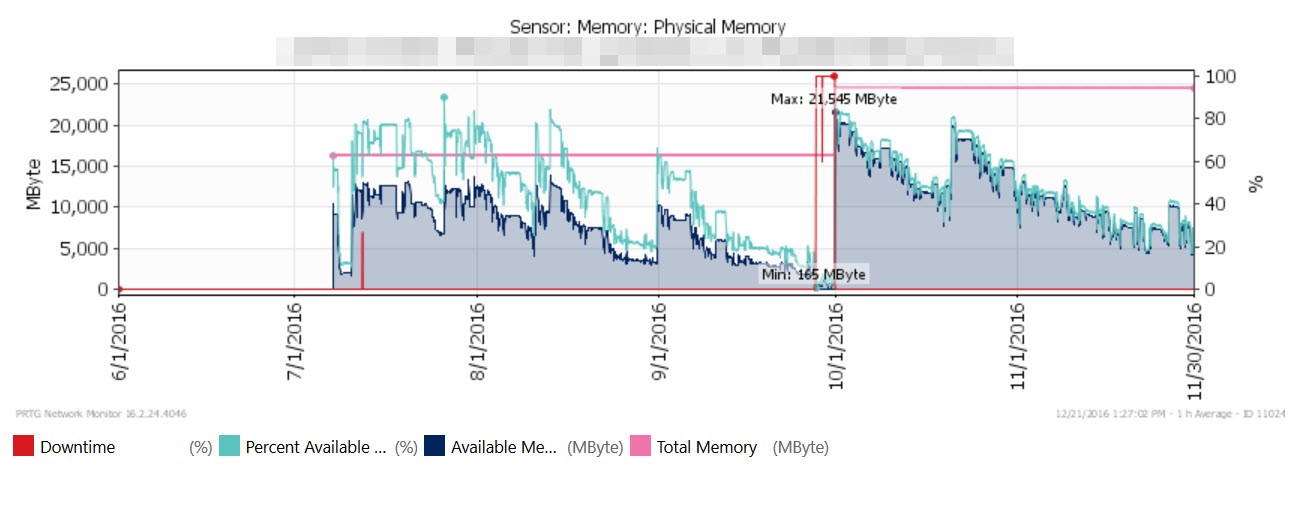
NAV 2015 S Tier. As you can see in the chart below we originally allocated this S Tier 16G and then in October increased it to 20G. We have no more than 40 concurrent out of about 80 named users. According to a Microsoft White Paper, which I found on ArcherPoints website here (thanks!):
http://www.archerpoint.com/sites/default/files/docs/ms-dynamics-nav-peformance-testing-wp.pdf
each Service Tier should have 500Mb of base memory plus an 10Mb per active session as a starting point. We have much more memory allocated to this Tier than what is suggested.
We do not see any other metrics such as CPU, Network, Disc, etc subsystems being overly utilized on either the Service Tier or MSSQL server except for the memory utilization of the S Tier.
We terminate inactive sessions after two hours. Other than that most of the Service Tier settings are default I believe.
Any help or insight into how we can evaluate what is actually consuming the memory or other things to check would be greatly appreciated!
The last 2 days the Service Tier used 18G/20G so I ended up restarting it this morning as users were complaining of performance issues.
Thanks NAVUG!
Matt
——————————
Matthew McGinley
IT Director
San Francisco Bay Coffee Company
Lincoln CA
—————————— -
Franz Kalchmair
MemberDecember 21, 2016 at 6:13 PM
what was the size of the database file in 09/10/11 ? how big is the db log file, is it’s size limited ? how about the sql service, how much memory does it use ? are there peaks times? do you run heavy batch jobs? do you connect to the nav database with external systems, e.g. using odbc? do you run jetreports ?
——————————
Franz Kalchmair
Dynamics NAV Engineer and Consultant
Microsoft MVP
Vienna
————————————————————————- -
Matthew McGinley
MemberDecember 21, 2016 at 6:37 PM
Hi and Thanks Franz!
Q: what was the size of the database file in 09/10/11 ?
A: I think you meant 09/10/16. Database is about 230GQ: how about the sql service, how much memory does it use.
A: About 24G on a separate dedicated server.Q: are there peaks times
A: Generally 7AM to 8PM PT with some users accessing it outside those hours.Q: do you run heavy batch jobs?
A: We run batch jobs which process sales ordershipment information and some inventory transactions. All this interfaces run on the same Tier Server but another Service Tier instance. If their was an issue with them I would assume that named tier would should the issue.Q: do you connect to the nav database with external systems
A: Yes. We have a few interfaces direct to MSSQL and a few through another Service Tier. But, we do have an inventory management system using web service on the Service Tier we are having issues with. Maybe we need to move that interface onto a dedicated service tier?Q:do you run jetreports
A: Yes. We connect Jet directly to the SQL DB and not through the service tier.Hopefully this helps and thanks for your help!
Matt
——————————
Matthew McGinley
IT Director
San Francisco Bay Coffee Company
Lincoln CA
————————————————————————- -
Marije Brummel
MemberDecember 22, 2016 at 3:35 AM
Matt,
Moving Job Schedule processes and webservices to a dedicated service tier is a good start.
We have 75 users on one service tier using 5GB of RAM. No special settings, just let it run.
The other service tier on a dedicated machine hosts jobs and external connections for a few 100 concurrent processes.
Database is 200GB and SQL Server has 100GB memory used.
You can run profiler to see if you have queries that do an excesive amount of reads or queries that take long but don’t read much data which are probably blocked.
If you do a technical upgrade to NAV2017 you get more telemetry written to the windows log. We will do this conversion over x-mas next weekend. Good thing about this is that you also get the new Job Queue which is not hammering your service tier anymore.
——————————
Mark Brummel
MVP Microsoft Dynamics NAV
Brummel Dynamics Services B.V.
Olst
————————————————————————- -
Shawn Landers
MemberDecember 22, 2016 at 7:47 AM
Hi,
So we had a very similar issue. We determined that the memory was being used, but never released back after the process completed. Therefore it would just build to the point where performance issues arose. We would restart the service tier and it would run from some time(5-7 days) before it would build back up to the point of all memory being used up.
What we did was create multiple service tiers to try to isolate what process was causing the problem. We separated each of our functional departments onto those different service tiers. For us, that led us to an issue with our Chargelogic integration. As it turned out there was an cumulative update released that addressed the issue, but we had not been applying CU’s due to customization. Our VAR helped us integrate that CU and apply the fix and we have not had the problem since.
You may not have Chargelogic, but it may be a similar issue so I would recommend isolating the service tiers as we did. Then you should at least be able to see what processes are leading to the memory leak. Once you narrow that down you can look deeper into what exact process is causing the issue and it will keep other users running normally. I would think typically this will come from some customized code unit.
Shawn
——————————
Shawn Landers
IT Manager
FoodState
Manchester NH
————————————————————————- -
David Machanick
MemberDecember 22, 2016 at 10:41 AM
One thing that can cause havoc with a service tier is a hung process running in a tight loop.
One blog also pointed out a change to one of the standard settings that will increase performance: change the metadata provider cache size from 150 to 5000. It uses a modest amount of additional RAM, but has a big impact on performance.
——————————
David Machanick
Sikich LLP
Garland TX
————————————————————————- -
Matthew McGinley
MemberDecember 22, 2016 at 10:59 AM
Thank you all for your suggestions and guidance! Lots of great actionable ideas!
Gotta love NAVUG!!!
Happy Holidays!
Matt
——————————
Matthew McGinley
IT Director
San Francisco Bay Coffee Company
Lincoln CA
————————————————————————-
DSC Communities replied 9 years, 5 months ago 1 Member · 0 Replies -
-
0 Replies
Sorry, there were no replies found.
The discussion ‘2015 Service Tier Memory Help’ is closed to new replies.
