
Power Platform
Power Platform
Organizer:
- JOSE Organized by
-
-
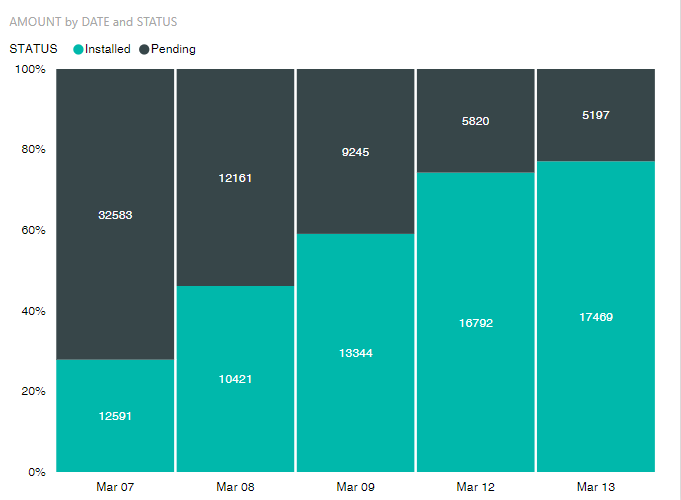
Replicating Excel 100% Stacked Chart in PowerBI
-
Replicating Excel 100% Stacked Chart in PowerBI


Sorry, there were no replies found.
The discussion ‘Replicating Excel 100% Stacked Chart in PowerBI’ is closed to new replies.
