
Power Platform
Power Platform
Organizer:
- JOSE Organized by
-
-
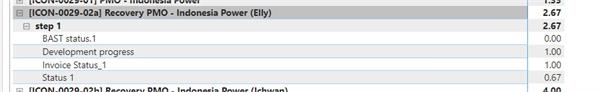
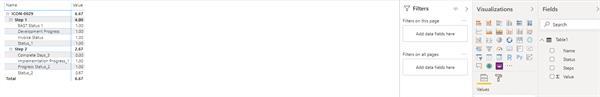
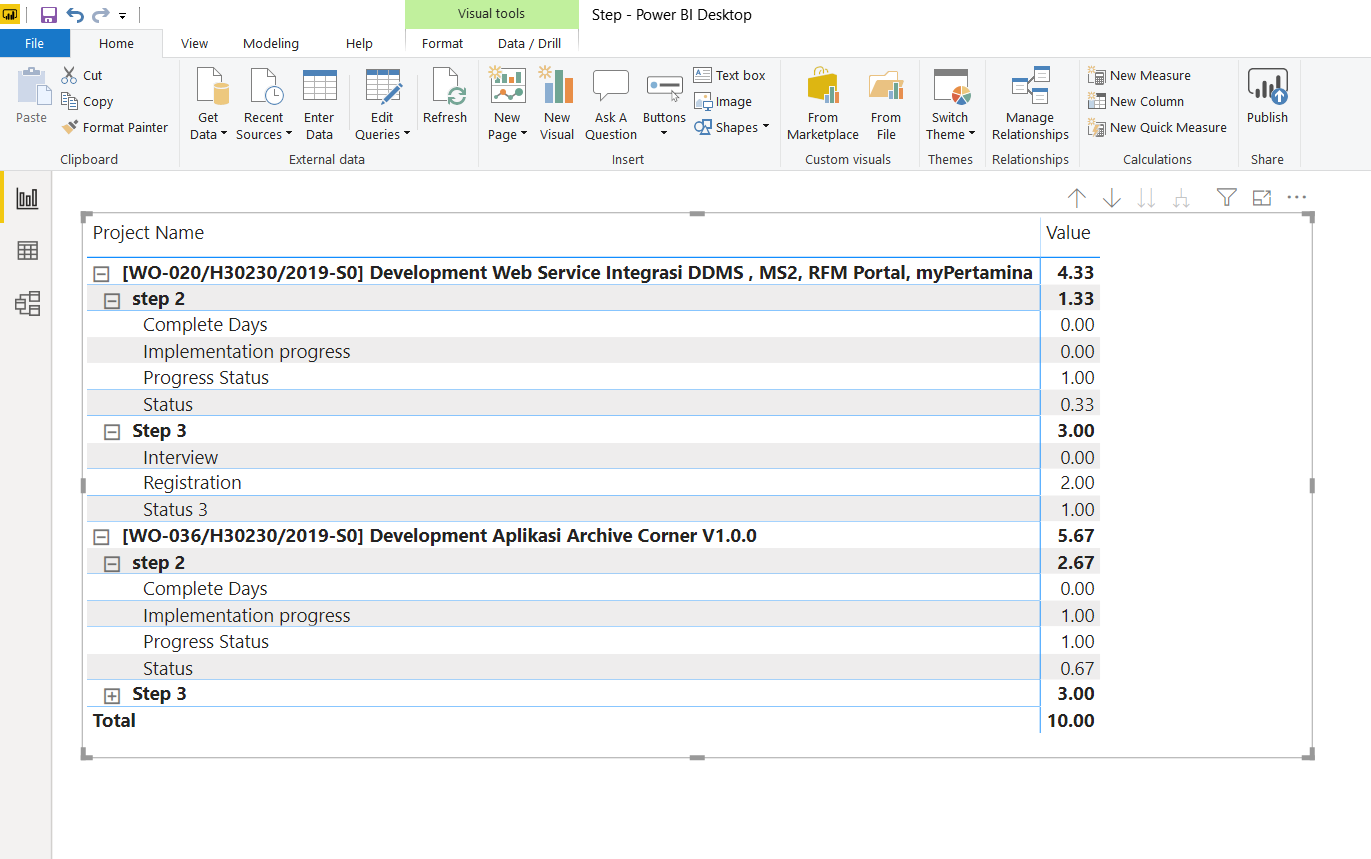
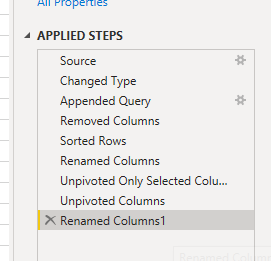
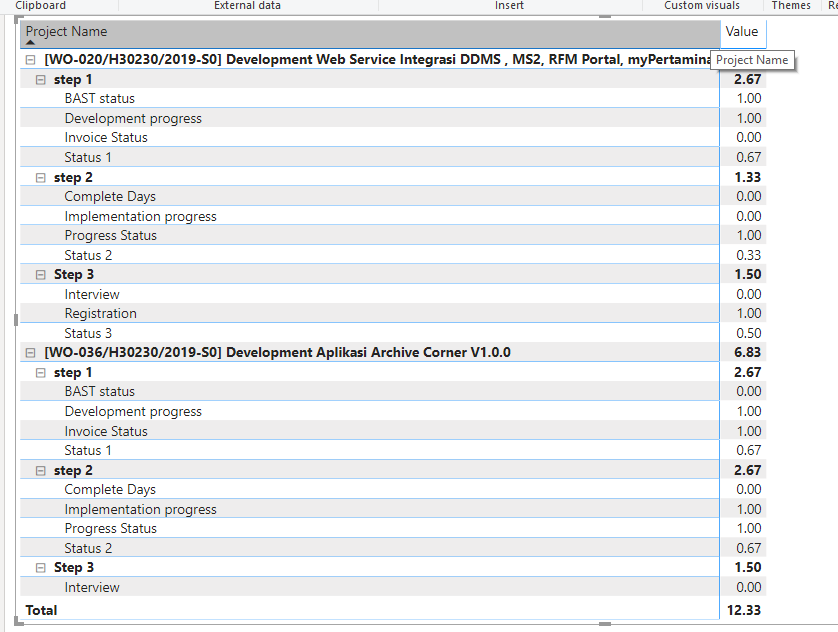
How to combine and show 2 diffrent Hierarcy in 1 Visual in Power Bi
-
How to combine and show 2 diffrent Hierarcy in 1 Visual in Power Bi


Sorry, there were no replies found.
The discussion ‘How to combine and show 2 diffrent Hierarcy in 1 Visual in Power Bi’ is closed to new replies.
