
Power Platform
Public Group
Active a day ago
Power Platform
Organizer:
- JOSE Organized by
-
-
Display % of Total in Treemap
-
Display % of Total in Treemap
Posted by DSC Communities on August 31, 2020 at 3:35 pm-

Phil Hageman
MemberAugust 31, 2020 at 3:35 PM
I have created a Treemap graphic in Power BI that displays the size of each age category by the % of Total. I used an Account Count metric in the Values and chose “Show Value as Percent of Grand Total” option. However, I cannot do this in the Details field, so I am not sure how to display the % of grand total in the graphic. It does have the % of Grand Total listed in the tooltip, but I am not sure how to add the % to the graphic itself.
Any help would be appreciated.Thanks!
Phil——————————
Phil Hageman
—————————— -
William Skelley
MemberAugust 31, 2020 at 4:22 PM
Hi Phil:You could ad a measure and use it as a tool tip or in a visual.
Here’s the format for a Sales % of Total. Sales_Data is the table and [Gross Sales] is the measure which sums up the Gross Sales.
Share of sales = DIVIDE(SUMX(Sales_Data, [Gross Sales]),
SUMX(ALLSELECTED(Sales_Data), [Gross Sales]))
I hope this helps.
Thanks,
Bill S
——————————
William Skelley
01106
Longmeadow MA
8602807221
——————————
——————————————- -
Phil Hageman
MemberAugust 31, 2020 at 6:09 PM
When I tried using this formula and adding to Details, it just gives me 100% for every measure.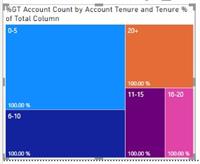
——————————
Phil Hageman
——————————
——————————————- -
William Skelley
MemberAugust 31, 2020 at 6:19 PM
Hi Phil:Do you want to share an example file? That doesn’t seem correct?
Thanks,
Bill
——————————
William Skelley
01106
Longmeadow MA
8602807221
——————————
——————————————- -
Phil Hageman
MemberSeptember 1, 2020 at 5:53 PM
William,
Attached is an example. Thanks so much for the help.Phil
——————————
Phil Hageman
——————————
——————————————- -
William Skelley
MemberSeptember 1, 2020 at 8:42 PM
Hi Phil:I attached an image to help you with the format. If you click on your visual, select the format tool and turn data labels on.
As a side note, if you download Power BI from the Microsoft Store you will always have the latest version of Power BI. I noticed your version was older than mine.
I hope this helps you. If this is a solution you can check the recommend button if you don’t mind. Thanks!
Best regards,
Bill
——————————
William Skelley
01106
Longmeadow MA
8602807221
——————————
——————————————- -
Phil Hageman
MemberSeptember 2, 2020 at 2:41 PM
What a simple solution. I feel foolish. Thanks so much.I will check with our IT department to see if we can get an upgraded version.
Thanks!
Phil——————————
Phil Hageman
——————————
——————————————- -
William Skelley
MemberSeptember 2, 2020 at 2:45 PM
Hi Phil:No question is bad. There are tons of things under my nose I’ve still yet to discover too.
Thanks,
Bill
——————————
William Skelley
01106
Longmeadow MA
8602807221
——————————
——————————————-
DSC Communities replied 5 years, 6 months ago 1 Member · 0 Replies -
-
0 Replies
Sorry, there were no replies found.
The discussion ‘Display % of Total in Treemap’ is closed to new replies.
