
Power Platform
Public Group
Active 2 days ago
Power Platform
Organizer:
- JOSE Organized by
-
-
Difficult data model in Power Query
-
Difficult data model in Power Query
Posted by DSC Communities on February 17, 2020 at 3:25 pm-

Rob Parti
MemberFebruary 17, 2020 at 3:25 PM
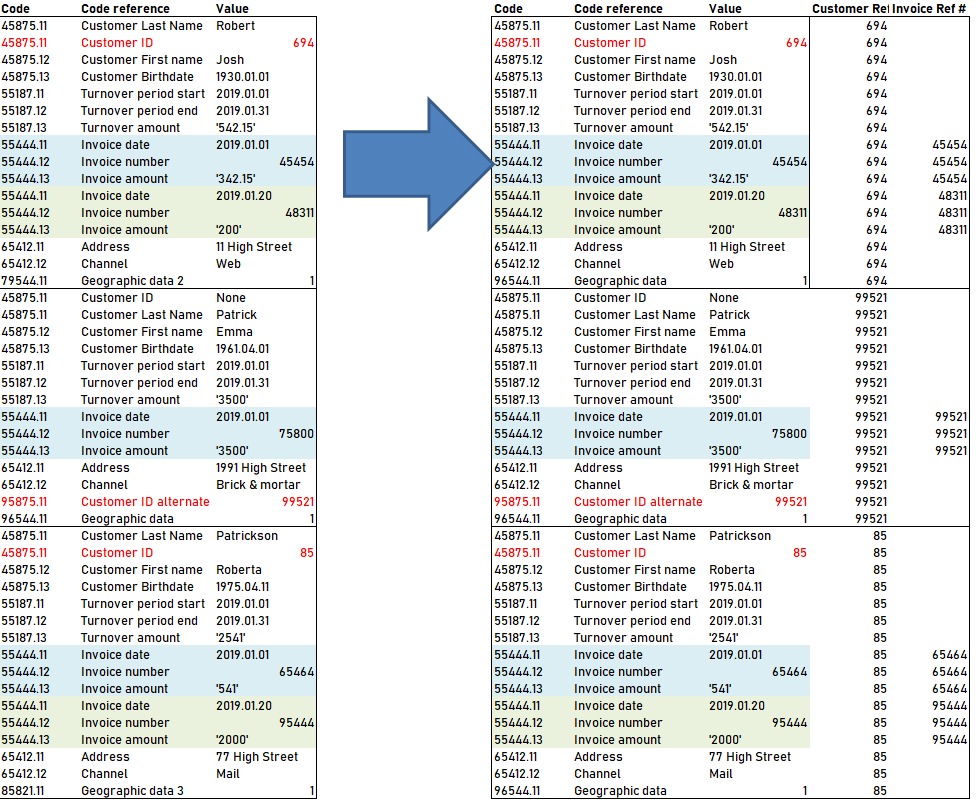
Hi,Despite thinking for a few months, I can’t seem to find a solution to transform the following data in PowerQuery of a client invoice data file.
I am looking for a solution in Power Query rather than DAX functions. This is a big data source that I need to work out in usual facts/dimensions tables right in Power Query.
Each month I get a three column file. Unfortunately, the customer ID can be associated with a different code in the first column. Therefore, I can’t use the fill down function properly or If statements.
Also the first and last property codes for each customers is not necessarily the same so I have trouble delimiting each customer sections.On the left part is the original data. On the right one, the last two columns are what I’m trying to achieve.
Thanks a lot for your help !
——————————
Rob Parti
—————————— -
Sean Graham
MemberFebruary 18, 2020 at 4:21 AM
Hi Rob,
This could be potentially achieved by using group index in Power Query.
But what makes it a lot more tricky is that the code and code references are not always the same for each section.
For example :
There can be Customer ID alternate in one section but not the other?
There can be more than 1 invoice date, number and amount i.e. multiple invoices in each section?
Why Geographic data, Geographic data 2 and Geographic data 3?Thanks,
Sean
——————————
Sean Graham
BI Consultant
Dublin
——————————
——————————————- -
Rob Parti
MemberFebruary 18, 2020 at 2:49 PM
Hi Sean, DavidThank you both for your answers.
Sean, yes the difficulty is the fact that the customer ID doesn’t necessarily have the same code.
“There can be Customer ID alternate in one section but not the other?” Yes
“There can be more than 1 invoice date, number and amount i.e. multiple invoices in each section?” Yes
“Why Geographic data, Geographic data 2 and Geographic data 3?” This is how the data we get is structured unfortunately.I will look into the group index function.
David, I agree with you that the data shouldn’t be that way but we have no way to get a more structured file.
I have managed to unpivot it to have column with the same kind of datas. The issue is finding a common id after unpivoting.Thanks
——————————
Rob Parti
——————————
——————————————- -
Sean Graham
MemberFebruary 18, 2020 at 4:27 PM
Hi Rob,
Yes that is a challenge. Before looking into group by and index combination, if there is a way to get more uniform list of fields per section then that would help a great deal. For example Customer ID alternate is in each section and is blank or null if one does not exist. But even after that there is the number of invoices in each section. It could 1, 2 or even 10 I would assume.The following link gives a good example of how to use group by and index. You don’t have to sort as I presume that is already sorted per section in the data source. But you would group by Code and Code Reference.
http://datacornering.com/how-to-create-group-index-with-power-query-or-r/
But as I said if you had the data source with a common list of fields per section, then everything after this would be a lot easier.
Thanks
Sean
——————————
Sean Graham
BI Consultant
Dublin
——————————
——————————————- -
David Wetton
MemberFebruary 18, 2020 at 1:31 PM
I was looking at your “source” data in those three columns and I got dizzy trying to figure out I was seeing. I understand the difficulty or have in working with this data as there are many things that I can’t understand which makes it really difficult to process further. I don’t know if this is possible but assuming this data comes from some form of client/sales system I would think that the data would be in a much more usable format and could be extracted in an easier to understand format to allow you to with it further?The one column called “values” appears to have every form of data would be in a sales system. Dates are mixed with names, categories and other attributes that I would think should be in separate tables or at least separate columns? I’m somewhat of an novice myself so there may be ways that people with more experience could reverse engineer or reengineer these three columns you have been given but it sure stumps me.
I was thinking about how to use un-pivot but any un-pivoting to solved one issue would probably create another issue.
Those three segments of data showed in the three column table seemed to be to be almost the same as screenshots of an individual customer displaying all of the attributes for that customer. That information must be becoming from the source system and perhaps if you could negotiate with the person giving you these extracts you could get an extract that would probably solve most of the issues with only a few left to do in Power Query. Definitely a challenge but perhaps someone with more experience has some thoughts.
I also can’t figure out the purpose (or the value) of the column called “Code” to any form of reporting. They seem to be surrogates for the column headers that I would expect to see in a sales system. If they are truly duplicates of one headers are they needed? If “45875.11” were a synonym for “Customer ID” you only need one of these and most commonly we like the English words rather than the computer codes to work with. But as you highlighted it seems that this code is used in non-unique ways as “45875.11” also applies to “Customer Last Name”. Definitely puzzling to me.
——————————
David Wetton
Performance Evaluation Analsyt
Victoria BC
——————————
——————————————- -
Wallo Atkinson
MemberFebruary 24, 2020 at 2:59 PM
The code column is too inconsistent to try to utilize.
Just use the Code Reference column.
Create a separate query “UniqueCodeRefs” that lists all the unique possible values in the Code reference column. Add an index to it.
Merge that into your original query so that you end up with every set of records having the same number of rows. For instance every group ends up with a Customer ID alternate row even if it’s just null. Add an index row, “TableKey”. (The names don’t really matter. I just picked names for simplicity’s sake.
Now you know how many rows you have in each grouping because they all have the same now. Use the “UniqueCodeRefs” query and group by to get the count of how many rows per set. Merge that into your original query so you have a “GroupRowCt” column.
Then you would add a formula something like Number.RoundDown(TableKey-1)/GroupRowCt)+1.
That forumla isn’t exactly M code but it gives you the idea.
After you put in that formula, then you have a unique ID for each group of records that go together.
If you want, you can also now filter out the null Code reference values we added.With each group having a unique id now, you can do various groupings, merges, or pivots to get the data laid out the way you want.
——————————
Wallo Atkinson
Green Bay
——————————
——————————————- -
Rob Parti
MemberFebruary 25, 2020 at 3:16 PM
Hi Wallo,Many thanks for your help.
I will try that.
——————————
Rob Parti
——————————
——————————————- -
Simon Lamb
MemberFebruary 26, 2020 at 1:53 PM
Hi ,I’m not convinced that approach will work as it’s based on adding rows to each customer group to get them all having the same number of rows but there’s nothing in the data that identifies them as a group yet.
If your data follows some rough logic then we still might be able to find when each new group starts. Using Wallo’s UniqueCodeRefs table with an index column called [CodeIndex] we can add this to the table then test each row against the previous row. You also need an [Index] column in the main table and your query step will look something like:Table.AddColumn(#"Previous Step", "CustomerNumber", each if [Index]=0 then 1 else if ( [CodeIndex] - #"Previous Step" {[Index]-1}[CodeIndex] ) < -8 then [Index] else null)?
This tests the [CodeIndex] in the current row versus the previous row. ?If it’s the first row we enter 1, if it’s more than 8 less than the row above (this looks about right) then we take the [Index] value and otherwise it’s null. If you then fill down you’ll have unique numbers for each group of customer data. From there you can spin off a new table, filter on anything beginning ‘Customer ID’, filter out ‘None’ to end up with a lookup table of CustomerNumber to Customer ID.
I’d recommend you separate out the invoice data into a separate table seeing as you can have more than one per customer, and with the data that’s left you can Pivot to get a table with one row per Customer now that each has a unique identifier.
Hope that helps. Good luck!
——————————
Simon Lamb
IT Consultant, Method Excel Ltd.
——————————
——————————————- -
Rob Parti
MemberFebruary 26, 2020 at 3:00 PM
Hi Simon,Thank you for your help.
——————————
Rob Parti
——————————
——————————————-
DSC Communities replied 6 years ago 1 Member · 0 Replies -
-
0 Replies
Sorry, there were no replies found.
The discussion ‘Difficult data model in Power Query’ is closed to new replies.
