Hi all, I am trying to do some planning on how much to produce in a month, to know this i need to see how many items were sold in the past month. What is the most convenient way to do that? Our items have tons of different batch number so i need to be able to see the item as a whole not broken down into batch. Thanks for the time
—————————— Corey Armstrong Applied Medical Technologies, Inc. Brecksville OH ——————————
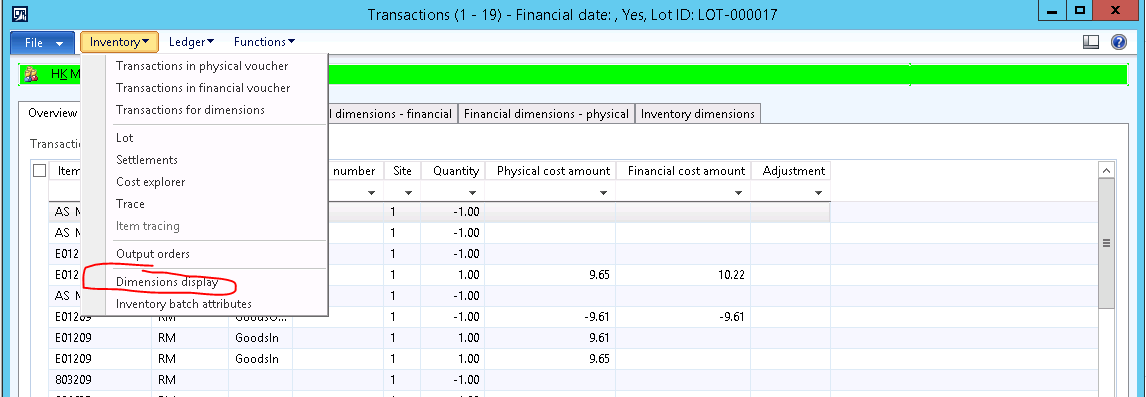
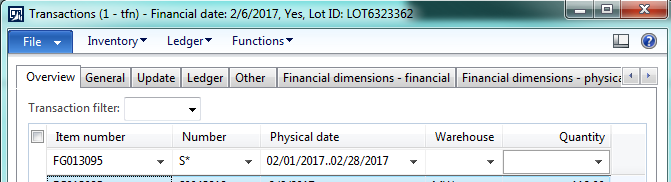
Hi Cory, When running the standard Transactions inquiry from the item or going to Inventory Mgt > Inquiries > Transactions, you can see the history by item. Just make sure you tick off “batch number” in your dimensions display and the batch will not be relevant for your query. In the Transactions form, you can use the other tabs like “General” to filter by transaction type if you only want to see Sales, for example.
—————————— Andrew Lencsak Senior Application Consultant eBECS Atlanta GA —————————— ——————————————-
Susan Lindner
Member
February 20, 2017 at 9:31 AM
Hi Corey,
I don’t know which version you are on. In 2012 R2, there is a standard AX report called “Sales item group statistics” found in Sales and Marketing > Reports > Statistics > Customer > Sales item group statistics. You can enter from and to dates and check the box called “Detailed, with item numbers” and it will generate a concise report for the time period with just item numbers and quantity sold, no batch numbers. You can then export this to Excel if desired.
—————————— Susan Lindner Glass Coatings & Concepts The Shepherd Holding Company Monroe OH —————————— ——————————————-
Jeff Watson
Member
March 9, 2017 at 6:53 PM
Corey-
There is a transactions report at Inventory management > Inquiries > Transactions > Transactions
It can be run for a single item (or other grouping by pulling in the desired fields) and filtering to your required date range.
We export to Excel, assign a week number to each date and get a report that details sales per item per week. We also use this for raw material usage into batch orders.
It has been very helpful in determining MIN/MAX and default order quantities based on historical usage. You can easily calculate a statistically relevant MIN/MAX that will cover a specified service level expectation.
—————————— Jeff Watson ERP Solution Manager Trilliant Food-Beverage-Nutrition Little Chute, WI USA —————————— ——————————————-
Please note:
This action will also remove this member from your connections and send a report to the site admin.
Please allow a few minutes for this process to complete.
Report
You have already reported this .
Welcome to our new site!
Here you will find a wealth of information created for peopleĀ that are on a mission to redefine business models with cloud techinologies, AI, automation, low code / no code applications, data, security & more to compete in the Acceleration Economy!