

Dynamics Business Central (NAV)
Public Group
Active 5 days ago
Experts:




A few thoughts on NAV 2016 Debugger…
-
A few thoughts on NAV 2016 Debugger…
Posted by Jason Wilder on June 28, 2017 at 8:19 am-
For the developers out there you probably know many of these things I am about to list but there may be one or two that you might not have known:
You can only Debug a user that is on the Service Tier that your Developer Environment is connected to. So if you go to Debug and you see no users, then switch to the correct Service Tier (or obviously no one is logged in).
You can only debug once per service tier at a time. So if you go in to Debug, choose your user and then see that the Debug and Debug Next buttons are disabled then this is most likely why. You can use a different Service Tier (with different users) if you need to debug at the same time.
I am sure everyone knows about the new Code Tracking button “Step Out”. Didn’t exist in Classic Client debugger and is a big time saver.
Another amazing feature that did not exist in Classic Client Debugger is the Stop button. It may not seem like a big deal but is actually one of my favorite adds to the debugger. As you are debugging you can hit the Stop button and it will throw an actual error and roll back to the last commit. This is very different than if you hit Continue or just closed the debugger as those actions would either complete the code and commit or go to the next breakpoint. My example on why this is so great is when you have to spend some time setting up a scenario to Debug. Sometimes it takes a few passes while debugging to figure out the problem. You can debug to a certain point, hit the Stop button and then start all over again with nothing being committed to the database. You can do this over and over until you figure out the issue. If you do not understand what I am saying then re-read this paragraph until you get it as this is a really nice feature.
Two ways to set breakpoints: From the object designer when you are in the object or while in Debug mode you can set it on the fly. A 3rd hackey (I know this is not a real word but hopefully will be someday) way to set a breakpoint is to open the Breakpoints page from the Debugger screen and manually insert one by entering the Object Type, Object No. and Line No.
The breakpoints are stored in a real system table called Debugger Breakpoint and is shared by all companies in your database. Restarting the Service Tier does not clear or do anything to your breakpoints since it is a real table. Debugging from a different machine has the exact same access as another machine. As far as I know nothing is stored in any files in regards to breakpoints like it was in the Classic Client.
Breakpoints set from within the debugger itself are not seen in Object Designer but if you go to enter the same breakpoint in object designer you will get a message like this one (this must be a bug!):
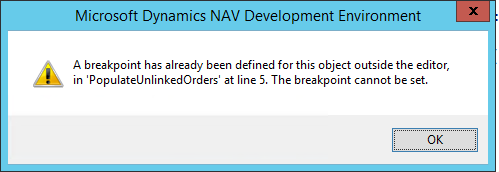
The only way (that I know) to tell if the breakpoint was set in Object Designer versus the Debugger is to pull up the Breakpoints Page and expose the field called “Function ID”. If Function ID is > 0 then it was set in Object Designer, if it is 0 it was set while debugging.
This Breakpoint page is a great place to remove only certain breakpoints such as maybe for only a certain object. Of course there is a Delete All button as well.
Breakpoint Rules are very simplistic and not all that I want them to be but they have their time and place. You can’t use “And’s” or “Or’s” or any complex statement. Basically you can do Field = 0 or Field > 5 or something like that. Someone else has probably written more on this subject.
That’s all I got. Hope it helps someone out there and please add or correct any mistakes.
——————————
Jason Wilder
Senior Application Developer
Stonewall Kitchen
York ME
—————————— -
Thanks a lot for this Jason! Some really good stuff in here.
I love the breakpoints as you laid it out. I’ll also add that you can set break rules for on error or on record change. This has been extremely helpful for me.
——————————
Joe Miller
Business System Analyst
Tender Corporation
Littleton NH
——————————
——————————————-
Jason Wilder replied 9 years, 3 months ago 1 Member · 0 Replies -
-
0 Replies

Sorry, there were no replies found.
The discussion ‘A few thoughts on NAV 2016 Debugger…’ is closed to new replies.