Power BI Data Modeling and Visuals Using GP Financial Data

Financial Data reveals how healthy your Company is. Preparing your data to make the results comprehensible for all consumers is essential, and that’s what is in this session. There will be tips on data modeling in Query Editor, DAX formulas, and ideas for Financial Visuals and KPIs. In this fast-paced session, we’ll walk through building a small P&L. Then we’ll go beyond the traditional Financial Statements, which I call Period Statements, and enter the informative world of “Operational” Reports. All using Dynamics GP Data.
Specific areas covered:
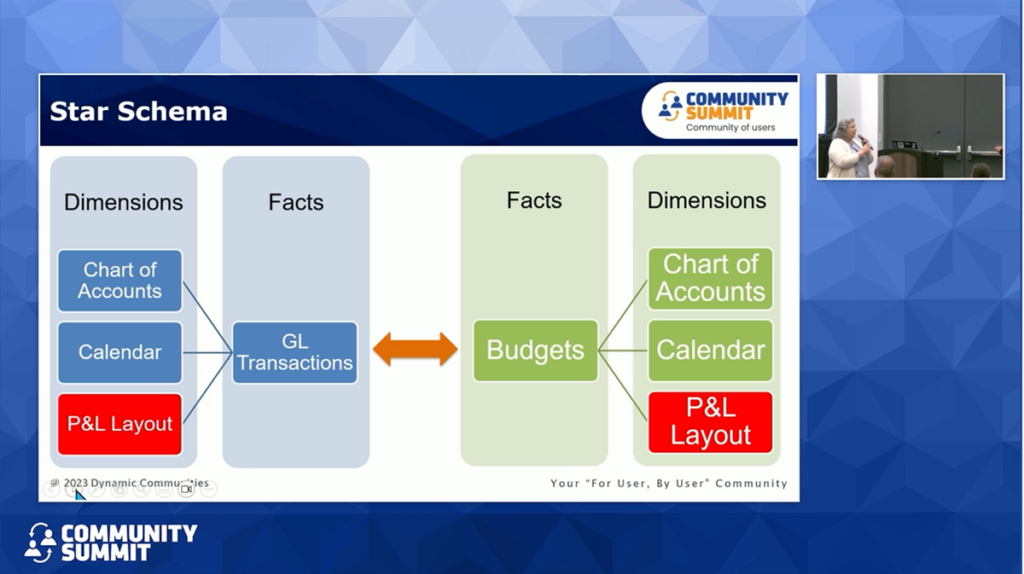
- Simplifying your Data Model
- Modeling the Chart of Accounts
- Modeling Transactions & Modeling Budgets
- Modeling Dates
- Suggestions for Financial Visuals.

